. 2011 Jan;60(1):288-97.
doi: 10.2337/db10-0818. Epub 2010 Sep 28.

Diminished superoxide generation is associated with respiratory chain dysfunction and changes in the mitochondrial proteome of sensory neurons from diabetic rats

Affiliations

Diminished superoxide generation is associated with respiratory chain dysfunction and changes in the mitochondrial proteome of sensory neurons from diabetic rats

Eli Akude et al. Diabetes. 2011 Jan.

Abstract

Objective: Impairments in mitochondrial function have been proposed to play a role in the etiology of diabetic sensory neuropathy. We tested the hypothesis that mitochondrial dysfunction in axons of sensory neurons in type 1 diabetes is due to abnormal activity of the respiratory chain and an altered mitochondrial proteome.

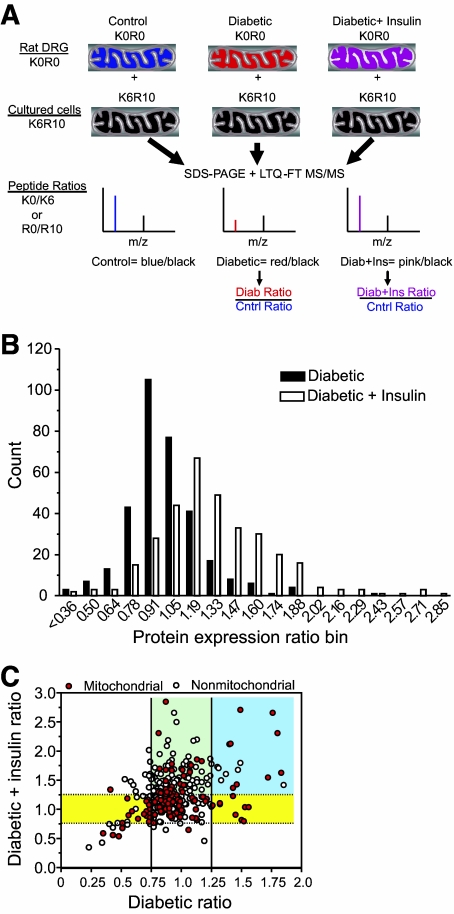
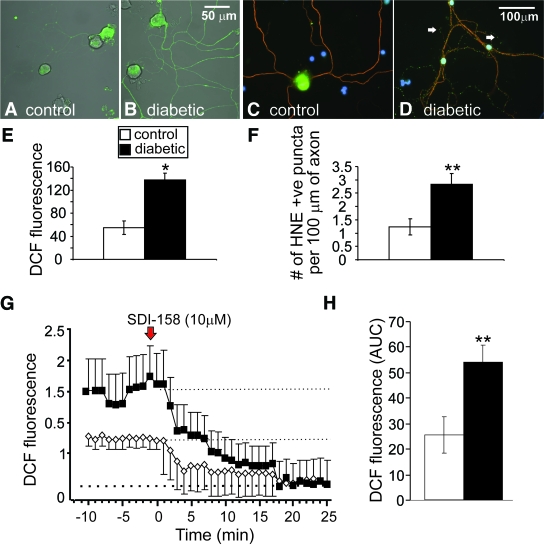
Research design and methods: Proteomic analysis using stable isotope labeling with amino acids in cell culture (SILAC) determined expression of proteins in mitochondria from dorsal root ganglia (DRG) of control, 22-week-old streptozotocin (STZ)-diabetic rats, and diabetic rats treated with insulin. Rates of oxygen consumption and complex activities in mitochondria from DRG were measured. Fluorescence imaging of axons of cultured sensory neurons determined the effect of diabetes on mitochondrial polarization status, oxidative stress, and mitochondrial matrix-specific reactive oxygen species (ROS).

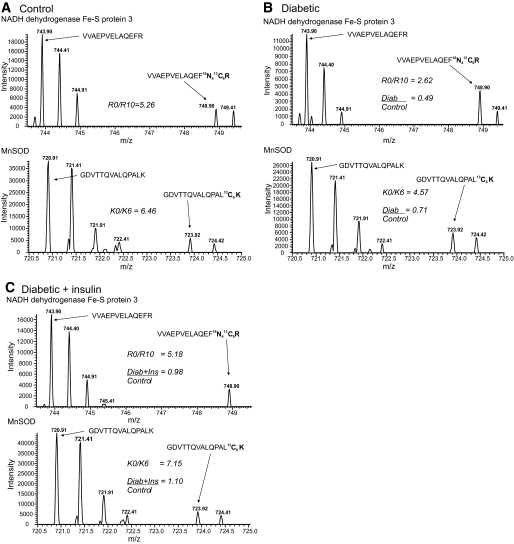
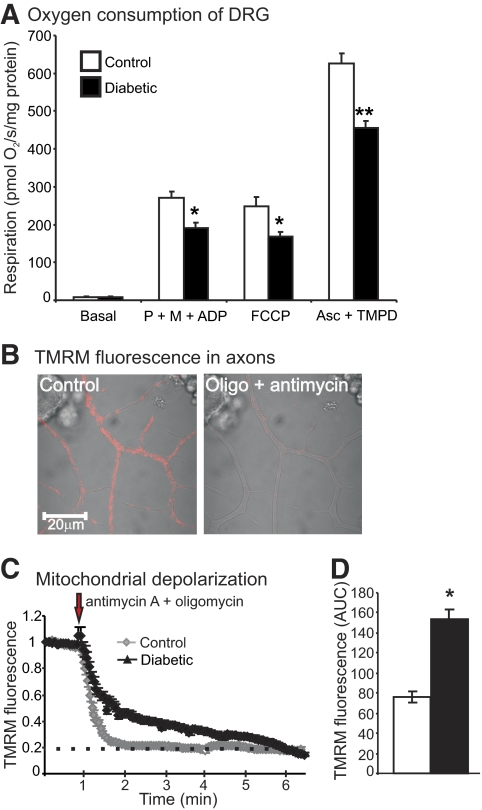
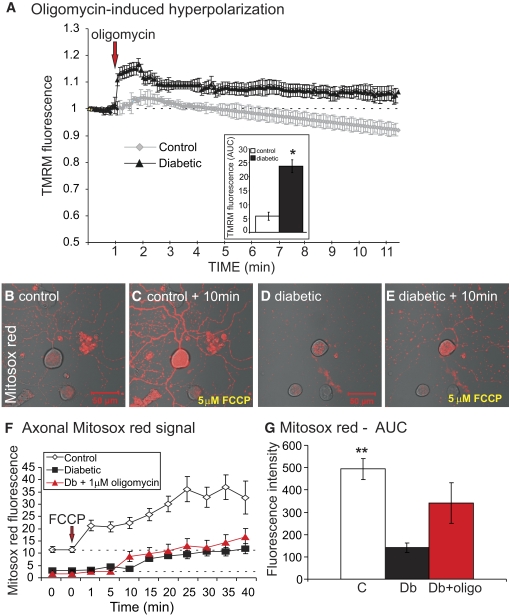
Results: Proteins associated with mitochondrial dysfunction, oxidative phosphorylation, ubiquinone biosynthesis, and the citric acid cycle were downregulated in diabetic samples. For example, cytochrome c oxidase subunit IV (COX IV; a complex IV protein) and NADH dehydrogenase Fe-S protein 3 (NDUFS3; a complex I protein) were reduced by 29 and 36% (P < 0.05), respectively, in diabetes and confirmed previous Western blot studies. Respiration and mitochondrial complex activity was significantly decreased by 15 to 32% compared with control. The axons of diabetic neurons exhibited oxidative stress and depolarized mitochondria, an aberrant adaption to oligomycin-induced mitochondrial membrane hyperpolarization, but reduced levels of intramitochondrial superoxide compared with control.

Conclusions: Abnormal mitochondrial function correlated with a downregulation of mitochondrial proteins, with components of the respiratory chain targeted in lumbar DRG in diabetes. The reduced activity of the respiratory chain was associated with diminished superoxide generation within the mitochondrial matrix and did not contribute to oxidative stress in axons of diabetic neurons. Alternative pathways involving polyol pathway activity appear to contribute to raised ROS in axons of diabetic neurons under high glucose concentration.


Figures

FIG. 1.
FIG. 1.
A: Schematic for use of culture-derived isotope tags for quantitative proteomics. Unlabeled (K0R0) mitochondrial fractions were prepared from the lumbar DRGs obtained from each animal in the three treatment groups. Each K0R0 mitochondrial fraction was mixed in a 2:1 ratio with K6R10-labeled mitochondria obtained from SC16 cells that had been metabolically labeled with 13C6 lysine (K6) and 13C6,15N4 arginine (R10) for 10 days. The proteins were resolved by SDS-PAGE, digested with trypsin, and analyzed by RP-HPLC/LTQ-FT MS/MS. For each protein, the ratio of K0R0 to K6R10 quantifies the endogenous protein relative to the internal standard. Dividing the protein ratios obtained in the diabetic or diabetic + insulin treatment by those obtained from control animals cancels out the K6R10 internal standard and provides the fold control value. B: Effect of diabetes and insulin therapy on mitochondrial protein expression. The protein expression ratios from the diabetic and diabetic + insulin treatments were binned and the number of proteins per bin counted. C: To determine the effect of diabetes and insulin therapy on mitochondrial versus nonmitochondrial proteins, the expression ratio for each protein was plotted against each treatment. Solid and dotted lines demarcate the threshold necessary for proteins to show a significant change in the diabetic and diabetic + insulin treatments, respectively. Proteins in between dotted and solid lines did not change with either treatment. Yellow shading indicates proteins that were significantly up- or downregulated by diabetes and normalized by insulin therapy. Blue shading indicates proteins that were increased by diabetes but not normalized by insulin therapy. Green shading indicates proteins not affected by diabetes but increased by insulin therapy.
FIG. 2.
FIG. 2.
Representative peptide mass spectra showing the effect of diabetes and insulin therapy on NDUFS3 and MnSOD. A: The upper spectrum shows the doubly-charged ion of the unlabeled (m/z 743.90) and R10 labeled (m/z 748.90) VVAEPVELAQEFR peptide of NDUFS3 from a control animal. Since the peptide is doubly charged, the mass difference is 5 atomic mass units; and the other peaks represent the isotopic envelope of the monoisotopic peak. The lower spectrum shows the doubly-charged ion of the unlabeled (m/z 720.91) and K6 labeled (m/z 723.91) GDVTTQVALQPALK peptide of Mn-SOD from a control animal. Since the peptide is doubly charged, the mass difference is 3 atomic mass units; and the other peaks represent the isotopic envelope of the monoisotopic peak. The R0/R10 and K0/K6 ratios for these peptides are indicated. B: Upper and lower spectra show the same NDUFS3 and Mn-SOD peptides, but from a diabetic animal. The K0R0/K6R10 ratios for each peptide are indicated and the Diab/Control ratio were obtained after dividing by the control ratios from panel A. C: Upper and lower spectra show the same NDUFS3 and Mn-SOD peptide, but from a diabetic + insulin-treated animal. The K0R0/K6R10 ratios for each peptide are indicated and the Diab/Control ratio were obtained after dividing by the control ratios from panel A. Note that the intensity of the K6 and R10 peptides are very similar between the treatments (A–C), indicating that the changes in protein expression are minimally influenced by the internal standard.
FIG. 3.
FIG. 3.
The mitochondria of DRG sensory neurons exhibited lower respiratory chain activity. A: Oxygen consumption was assessed in freshly isolated mitochondria from lumbar DRG of age-matched control and 22-week-old diabetic rats using an OROBOROS oxygraph 2k. Coupled respiration rates were measured in the presence of pyruvate (P) (10 mmol/l), malate (M) (5.0 mmol/l), and ADP (2.0 mmol/l). The addition of FCCP (0.5 μmol/l) permits a measure of uncoupled respiratory chain activity. Addition of ascorbate (Asc) (5.0 mmol/l) and TMPD (0.5 mmol/l) permit an analysis of complex IV activity that was verified by specific inhibitors. Values are mean ± SEM; n = 5. *P < 0.05 vs. controls; **P < 0.001 vs. controls. B: Images of fluorescence confocal microscopy using TMRM in live cultures of DRG neurons isolated from control adult rats showing effect of antimycin A and oligomycin. C: Trace of TMRM fluorescence signal in the axons of cultured DRG neurons isolated from age-matched controls and STZ-diabetic rats. D: Shows the area under the TMRM fluorescence trace (area under the curve) for control (open bar) and diabetic (filled bar) neurons. The area under the curve was estimated from the baseline (at the point of injection) to a fluorescence level of 0.2 and between time points 1.0 min and 6 min using sums of squares (shown by dotted line). Values are the means ± SEM, n = 65–80 axons; *P < 0.001 compared with control, t test. The TMRM trace was characterized by nonlinear regression (one phase exponential decay). The rate constant of decay (K) = 0.013 ± 0.0004 (control) and 0.006 ± 0.0001 (diabetic). Half-life of decay = 54.19 s (control) and 108.7 s (diabetic). The Fisher parametric (F) ratio = 409.5, P < 0.0001, control vs. diabetic. The F ratio compares the goodness-of-fit of the two curves. The red arrow indicates point of injection of antimycin A + oligomycin. (A high-quality digital representation of this figure is available in the online issue.)
FIG. 4.
FIG. 4.
Impaired respiratory function is associated with reduced ROS generation in the mitochondrial matrix of cultured neurons isolated from STZ-diabetic rats. A: TMRM fluorescence trace of oligomycin-induced mitochondrial inner membrane hyperpolarization in the axons of control and diabetic neurons. Values are mean ± SEM, n = 65–85 axons. Inset shows the area under the TMRM fluorescence trace (AUC) for control (open bar) and diabetic (filled bar) neurons. The AUC was estimated from the baseline (at the point of injection, dotted line), and between time points of 1.0 min and 4 min using sums of squares. Values are mean ± SEM, n = 65–80 axons,*P < 0.01 compared with control, t test. The red arrow indicates point of injection of oligomycin. B–E: Images of MitoSOX red fluorescence in cultures of DRG neurons showing the effect of 5.0 μmol/l FCCP. F: Quantification of real-time MitoSOX red fluorescence levels in the axons of cultured DRG neurons after 5.0 μmol/l FCCP treatment. MitoSOX trace was characterized by nonlinear regression. F ratio = 32.48, P < 0.0001 (control vs. diabetic with or without oligomycin by one-way ANOVA). Values are mean ± SEM, n = 18–73 axons. G: Area under the curve for MitoSOX red fluorescence intensity levels. Values are mean ± SEM, n = 35–73 axons; **P < 0.001 compared with diabetic or diabetic + oligomycin-treated cells by one-way ANOVA. (A high-quality digital representation of this figure is available in the online issue.)
FIG. 5.
FIG. 5.
Axons of sensory neurons from STZ-diabetic rats exhibit elevated oxidative stress that is ameliorated by the blockade of SDH. Images of ROS levels in axons at 24 h in adult DRG neuron culture from (A) control and (B) STZ-diabetic rats. Cultures were stained for ROS using CM-H2DCFDA dye (DCF is the fluorescent product resulting from oxidation). E: Quantification of ROS accumulation in axons. Values are means ± SEM, n = 44–57 axons, *P < 0.05 by t test. Immunofluorescent images of accumulation of adducts of 4-HNE in axons in sensory neuron cultures after 3 days; (C) is control and (D) is diabetic culture. F: Level of accumulation of puncta of adducts of 4-HNE in axons. Values are means ± SEM, n = 19–27 axons, **P < 0.01 by t test. G: Trace of DCF-fluorescence signal in the axons of cultured DRG neurons isolated from age-matched controls and STZ-diabetic rats and treated acutely with 10 μmol/l SDI-158. DCF fluorescence trace was characterized by nonlinear regression (one phase exponential decay). K = 0.09 ± 0.02 (control) and 0.13 ± 0.009 (diabetic). Half-life of decay = 7.5 min (control) and 5.5 min (diabetic). F ratio = 50.33, P < 0.0001, control versus diabetic. The red arrow indicates point of injection of SDI-158. H shows the area under the DCF fluorescence trace (AUC) for control (open bar) and diabetic (filled bar) neurons. The AUC was estimated from 0.2 to 1.6 on fluorescence axis and between time points 0 to 22 min using sums of squares (dotted lines show upper and lower limits). Values are means ± SEM, n = 42–51 axons; **P < 0.01 compared with control by t test. (A high-quality digital representation of this figure is available in the online issue.)

Similar articles

Cited by

References

    1. Vincent AM, Russell JW, Low P, Feldman EL: Oxidative stress in the pathogenesis of diabetic neuropathy. Endocr Rev 2004;25:612–628 - PubMed
    1. Nishikawa T, Edelstein D, Du XL, Yamagishi S, Matsumura T, Kaneda Y, Yorek MA, Beebe D, Oates PJ, Hammes HP, Giardino I, Brownlee M: Normalizing mitochondrial superoxide production blocks three pathways of hyperglycaemic damage. Nature 2000;404:787–790 - PubMed
    1. Du XL, Edelstein D, Rossetti L, Fantus IG, Goldberg H, Ziyadeh F, Wu J, Brownlee M: Hyperglycemia-induced mitochondrial superoxide overproduction activates the hexosamine pathway and induces plasminogen activator inhibitor-1 expression by increasing Sp1 glycosylation. Proc Natl Acad Sci U S A 2000;97:12222–12226 - PMC - PubMed
    1. Coppey LJ, Gellett JS, Davidson EP, Yorek MA: Preventing superoxide formation in epineurial arterioles of the sciatic nerve from diabetic rats restores endothelium-dependent vasodilation. Free Radic Res 2003;37:33–40 - PubMed
    1. Ola MS, Berkich DA, Xu Y, King MT, Gardner TW, Simpson I, LaNoue KF: Analysis of glucose metabolism in diabetic rat retinas. Am J Physiol Endocrinol Metab 2006;290:E1057–1067 - PubMed

Publication types

MeSH terms