. 2010 Oct 15;24(20):2317-29.
doi: 10.1101/gad.1957110. Epub 2010 Sep 28.

Neurofibromatosis-1 regulates neuroglial progenitor proliferation and glial differentiation in a brain region-specific manner

Affiliations

Neurofibromatosis-1 regulates neuroglial progenitor proliferation and glial differentiation in a brain region-specific manner

Da Yong Lee et al. Genes Dev. .

Abstract

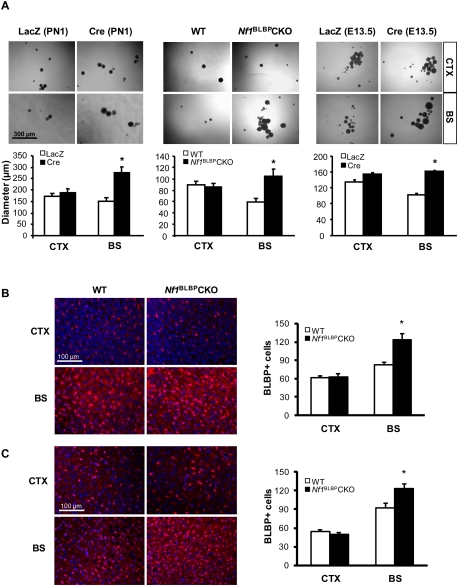
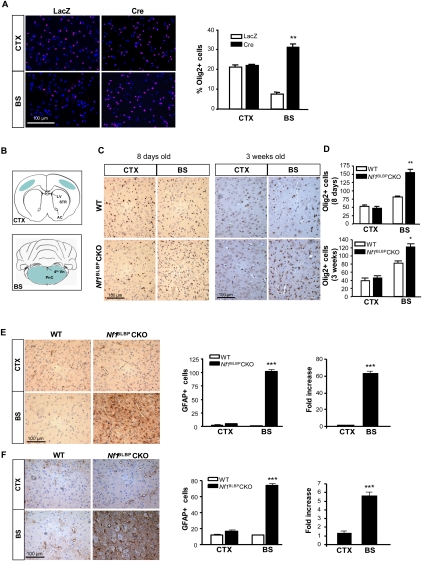
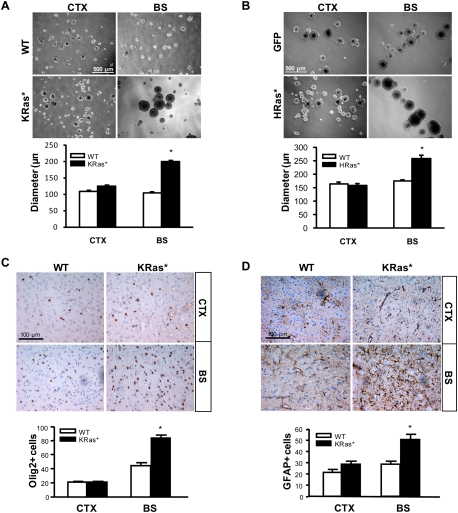
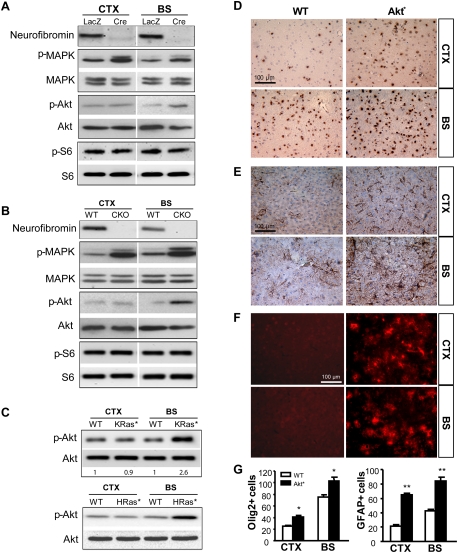
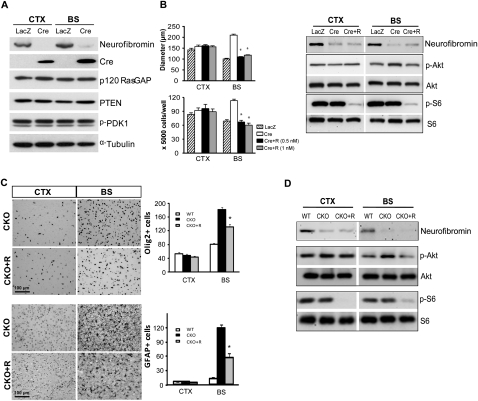
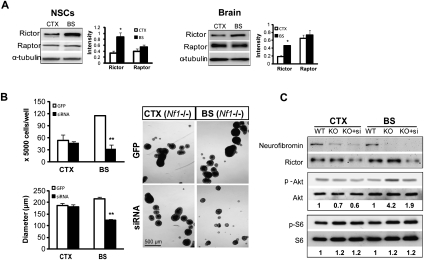
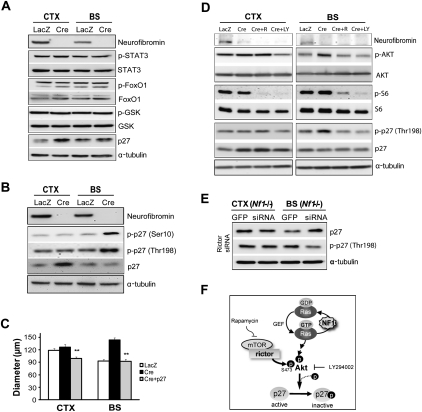
Recent studies have shown that neuroglial progenitor/stem cells (NSCs) from different brain regions exhibit varying capacities for self-renewal and differentiation. In this study, we used neurofibromatosis-1 (NF1) as a model system to elucidate a novel molecular mechanism underlying brain region-specific NSC functional heterogeneity. We demonstrate that Nf1 loss leads to increased NSC proliferation and gliogenesis in the brainstem, but not in the cortex. Using Nf1 genetically engineered mice and derivative NSC neurosphere cultures, we show that this brain region-specific increase in NSC proliferation and gliogenesis results from selective Akt hyperactivation. The molecular basis for the increased brainstem-specific Akt activation in brainstem NSCs is the consequence of differential rictor expression, leading to region-specific mammalian target of rapamycin (mTOR)/rictor-mediated Akt phosphorylation and Akt-regulated p27 phosphorylation. Collectively, these findings establish mTOR/rictor-mediated Akt activation as a key driver of NSC proliferation and gliogenesis, and identify a unique mechanism for conferring brain region-specific responses to cancer-causing genetic changes.


Figures

Figure 1.
Figure 1.
Nf1 inactivation increases BS NSC proliferation. (A) Nf1 loss results in increased BS NSC neurosphere size, with no effect on CTX NSCs. Identical results were obtained with PN1 NSCs following acute Nf1 inactivation with Ad5-Cre (Cre), PN1 NSCs from Nf1BLBPCKO mice, or E13.5 NSCs after Nf1 inactivation. For controls, Nf1flox/flox NSCs were infected with Ad5-LacZ (LacZ). Phase contrast images show representative neurospheres, which are graphically illustrated below. Similarly, increased numbers of BLBP+ cells by immunofluorescence were observed in the BS of PN1 (B) and PN8 (C) mice, with no increase seen in the CTX. Sections were counterstained with DAPI. Graphs show the number of BLBP+ cells per surface area (0.1 mm2). Values denote the mean ± SEM. (*) P < 0.05. Bars: A, 300 μm; B,C, 100 μm.
Figure 2.
Figure 2.
Nf1 inactivation increases the number of BS Olig2+ glial progenitors and GFAP+ astrocytes. (A) The number of Olig2+ cells (red) was increased in Nf1−/− BS NSCs (Cre) compared with wild-type NSCs (LacZ). No increases were observed in CTX NSCs. Cells were counterstained with DAPI (blue). (B) Schematic shows the brain regions used for direct cell counting (blue). (CC) Corpus callosum; (LV) lateral ventricle; (AC) anterior commissure; (Vn) ventricle; (PnC) pontine nucleus, caudal. (C) The number of Olig2+ glial progenitor cells was increased in the BS of Nf1BLBPCKO mice at both PN8 and PN18 compared with wild-type (WT) mice. There was no increase in the number of Olig2+ cells in the CTX of Nf1BLBPCKO mice. Graphs show the number of Olig2+ cells per surface area (0.1 mm2) (D). Increased numbers of GFAP+ cells were observed in the BS of Nf1BLBPCKO mice at both PN8 (E) and PN18 (F) compared with wild-type mice. There was no increase in the number of GFAP+ cells in the CTX of Nf1BLBPCKO mice. The number of GFAP+ cells per surface area (0.1 mm2; left) and fold change (Nf1BLBPCKO/WT; right) of GFAP+ cells are graphically represented. Values denote the mean ± SEM. (*) P < 0.005; (**) P < 0.001; (***) P < 0.0001. Bars, 100 μm.
Figure 3.
Figure 3.
Ras expression results in increased NSC proliferation and gliogenesis only in the BS. Neurosphere size (NSC proliferation) was increased in KRas*expressing (A) and HRas*expressing (B) BS NSCs. There was no increase in the diameters of KRas* or HRas* CTX NSCs. (C) The number of Olig2+ cells was increased in the BS of PN18 KRas* mice. There was no change in the number of Olig2+ cells in the CTX. (D) The number of GFAP+ astrocytes was increased in the BS of KRas* mice. Olig2+ and GFAP+ cell numbers per surface area (0.1 mm2) are graphically represented. Values denote the mean ± SEM. (*) P < 0.01. Bars: A,B, 500 μm; C,D, 100 μm.
Figure 4.
Figure 4.
The region-specific effects of Nf1 loss on NSC proliferation and gliogenesis are Akt-dependent. (A) MAPK activation was increased in both CTX and BS NSCs (PN1 Nf1flox/flox) after Nf1 inactivation (Cre). Infection with Ad5-LacZ (LacZ) was used as a wild-type (WT) control. The level of activated Akt (Ser 473) was increased only in BS Nf1−/− (Cre) NSCs relative to wild-type (LacZ) BS NSCs. No change in p-S6 was observed. (B) MAPK activation was increased in both CTX and BS NSC cultures from Nf1BLBPCKO (CKO) mice. Increased Akt activation was observed only in BS NSCs. No change in p-S6 was observed. (C) Akt activation was similarly increased only in BS NSCs expressing KRas* (2.6-fold increase, P = 0.0034) and HRas*. The number of Olig2+ cells (D) as well as GFAP+ cells (E) was increased in both the CTX and the BS of PN18 Akt*mice. (F) GFP immunohistochemistry shows that the Akt transgene is highly expressed in the Akt* mouse brain. (G) The numbers of Olig2+ and GFAP+ cells per surface area (0.1 mm2) are quantitated. Values represent mean ± SEM. (*) P < 0.05; (**) P < 0.01. Bars, 100 μm.
Figure 5.
Figure 5.
Region-specific effects of rapamycin on Nf1−/− NSC proliferation and gliogenesis. (A) The levels of p120 Ras-GAP, PTEN, and p-PDK1 are equivalently expressed in Nf1−/− NSCs (Cre) compared with wild-type (LacZ). Western blotting of neurofibromin and Cre recombinase shows loss of neurofibromin expression in Ad5-Cre-infected Nf1flox/flox NSCs. α-Tubulin was used as an internal loading control. (B) Decreased Nf1−/− BS NSC proliferation was observed following treatment with rapamycin. There was no effect of rapamycin treatment (Cre + R) on CTX NSCs. Akt activation (Ser 473; p-Akt) was reduced to control levels in rapamycin-treated (1 nM) Nf1−/− BS NSCs. In both BS and CTX NSCs, S6 activation (p-S6) was inhibited by rapamycin treatment. (C) Decreased numbers of Olig2+ glial progenitors and GFAP+ astrocytes were observed in the BS of PN8 Nf1BLBPCKO mice treated with rapamycin (CKO + R) in vivo. (D) Akt activation was decreased following rapamycin treatment in the BS of Nf1BLBPCKO mice in vivo. p-S6 was inhibited by rapamycin treatment in both the BS and CTX in vivo. Values represent mean ± SEM. (*) P < 0.0001. Bar, 100 μm.
Figure 6.
Figure 6.
Differences in mTOR regulation of Akt underlie the brain region-specific differences in Nf1−/− NSC proliferation. (A) Rictor expression was higher in the BS compared with the CTX in vitro (NSCs; threefold) and in vivo (brain; 2.6-fold). There was no difference in raptor expression. Results were quantitated by scanning densitometry using α-tubulin as an internal loading control. (B) Rictor silencing by lentiviral rictor siRNA (siRNA) decreased neurosphere size in Nf1−/− BS NSC cultures. No change was observed in Nf1−/− CTX NSCs following rictor silencing. Lentivirus-GFP (GFP) served as a control for viral infection. (C) The fold change in p-Akt and p-S6 (after normalization to total Akt and S6, respectively) relative to wild-type (WT) controls is indicated below the blots. Error bars denote the mean ± SEM. (*) P < 0.05; (**) P < 0.01. Bar, 500 μm.
Figure 7.
Figure 7.
Differential phosphorylation of p27 results from mTOR/rictor/Akt-mediated activation in Nf1−/− BS NSCs. (A) p27 expression was increased exclusively in Nf1−/− BS NSCs compared with wild type, whereas no regional difference in the level of phospho-STAT3, FoxO1, or GSK was observed following Nf1 loss. Ad5-LacZ (LacZ) served as a control for viral infection. (B) Nf1 loss resulted in increased p27 phosphorylation (p-p27; Ser 10 and Thr 198) in Nf1−/− BS NSCs. (C) Ectopic p27 expression in Nf1−/− BS NSCs restored proliferation to wild-type levels. (D) p27 phosphorylation (p-p27; Thr 198) in Nf1−/− BS NSCs was reduced by rapamycin (1 nM) and LY294002 (20 μM) treatment. (E) p27 expression in Nf1−/− BS NSCs was increased following rictor siRNA silencing. In contrast, p27 phosphorylation (Thr 198) in Nf1−/− BS NSCs was reduced following rictor siRNA treatment. No change in p27 expression or phosphorylation was observed following rictor KD in Nf1−/− CTX NSCs. α-Tubulin was included as an internal loading control for Western blotting. (F) Rictor-mediated Akt activation regulates p27 phosphorylation and function in Nf1−/− BS NSCs. Error bars denote the mean ± SEM. (**) P < 0.01.

Comment in

References

    1. Alcantara Llaguno S, Chen J, Kwon CH, Jackson EL, Li Y, Burns DK, Alvarez-Buylla A, Parada LF 2009. Malignant astrocytomas originate from neural stem/progenitor cells in a somatic tumor suppressor mouse model. Cancer Cell 15: 45–56 - PMC - PubMed
    1. Armando S, Lebrun A, Hugnot JP, Ripoll C, Saunier M, Simonneau L 2007. Neurosphere-derived neural cells show region-specific behaviour in vitro. Neuroreport 18: 1539–1542 - PubMed
    1. Bachoo RM, Kim RS, Ligon KL, Maher EA, Brennan C, Billings N, Chan S, Li C, Rowitch DH, Wong WH, et al. 2004. Molecular diversity of astrocytes with implications for neurological disorders. Proc Natl Acad Sci 101: 8384–8389 - PMC - PubMed
    1. Basu TN, Gutmann DH, Fletcher JA, Glover TW, Collins FS, Downward J 1992. Aberrant regulation of ras proteins in malignant tumour cells from type 1 neurofibromatosis patients. Nature 356: 713–715 - PubMed
    1. Bennett MR, Rizvi TA, Karyala S, McKinnon RD, Ratner N 2003. Aberrant growth and differentiation of oligodendrocyte progenitors in neurofibromatosis type 1 mutants. J Neurosci 23: 7207–7217 - PMC - PubMed

Publication types

MeSH terms

Substances