. 2010 Dec;59(12):1606-16.
doi: 10.1136/gut.2010.213686. Epub 2010 Sep 28.

A novel mechanism of acid and bile acid-induced DNA damage involving Na+/H+ exchanger: implication for Barrett's oesophagus

Affiliations

A novel mechanism of acid and bile acid-induced DNA damage involving Na+/H+ exchanger: implication for Barrett's oesophagus

Aaron Goldman et al. Gut. 2010 Dec.

Abstract

Objective: Barrett's oesophagus is a premalignant disease associated with oesophageal adenocarcinoma. The major goal of this study was to determine the mechanism responsible for bile acid-induced alteration in intracellular pH (pH(i)) and its effect on DNA damage in cells derived from normal oesophagus (HET1A) or Barrett's oesophagus (CP-A).

Design: Cells were exposed to bile acid cocktail (BA) and/or acid in the presence/absence of inhibitors of nitric oxide synthase (NOS) or sodium-hydrogen exchanger (NHE). Nitric oxide (NO), pH(i) and DNA damage were measured by fluorescent imaging and comet assay. Expression of NHE1 and NOS in cultured cells and biopsies from Barrett's oesophagus or normal squamous epithelium was determined by RT-PCR, immunoblotting or immunohistochemistry.

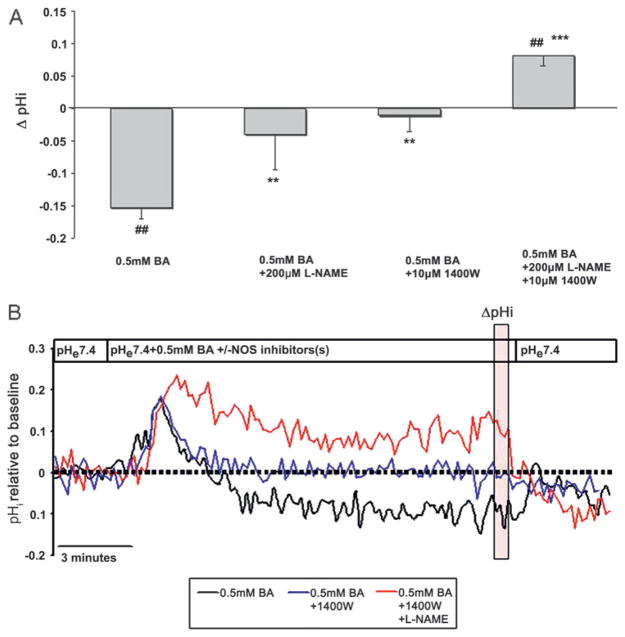
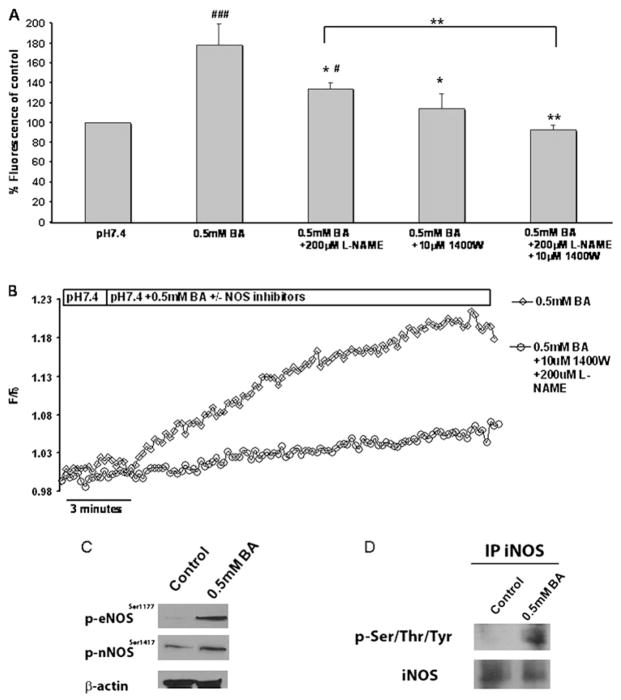
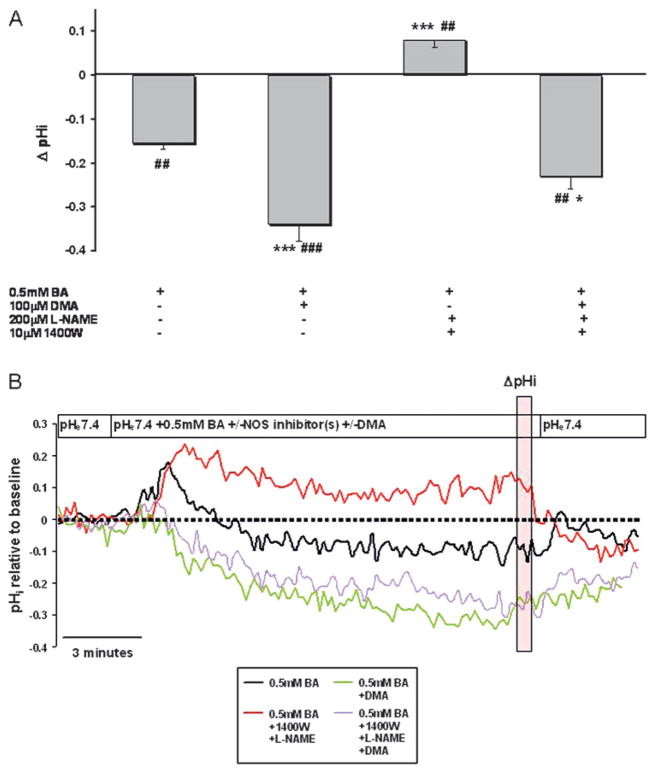
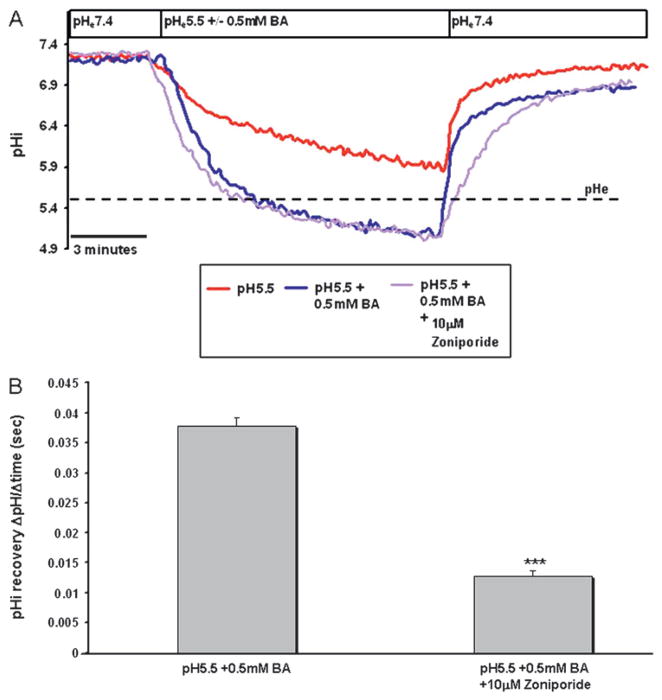
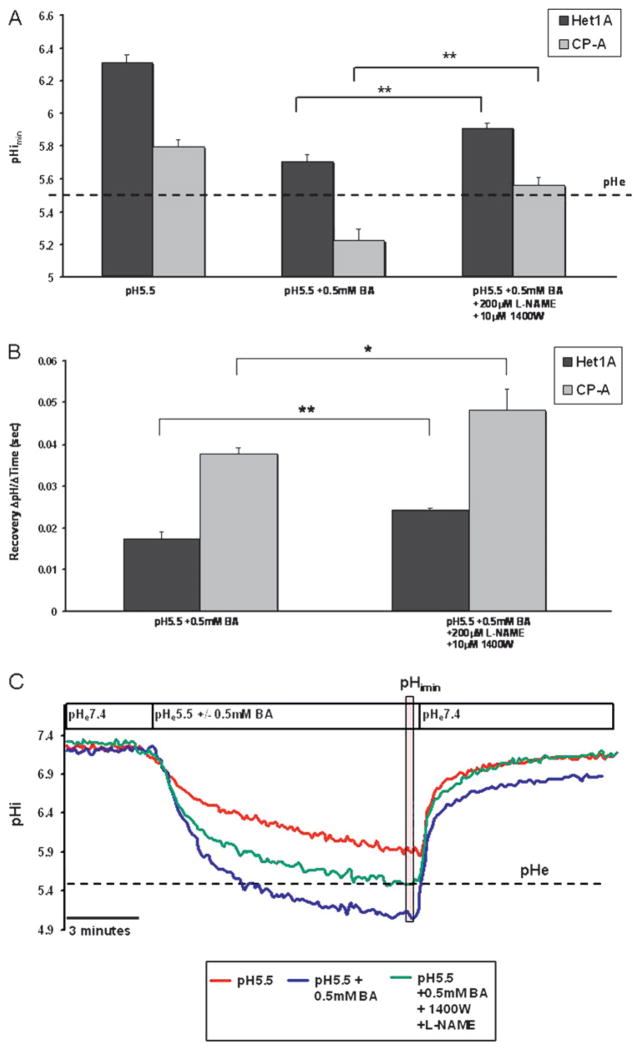
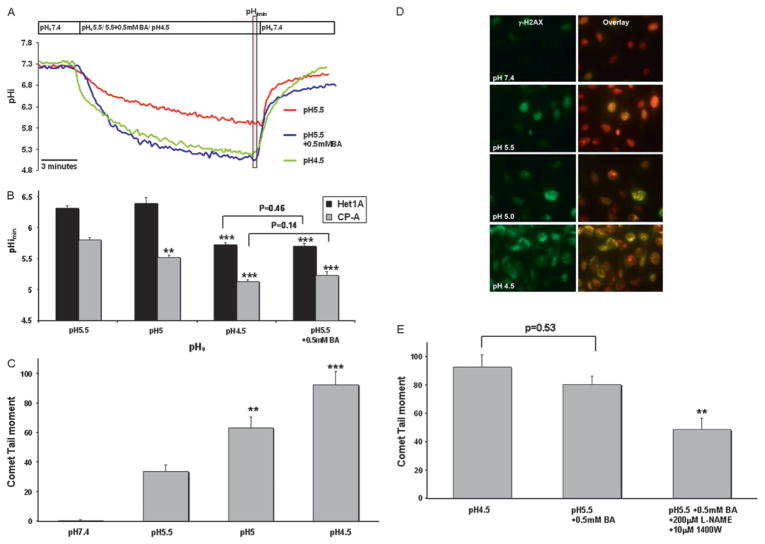
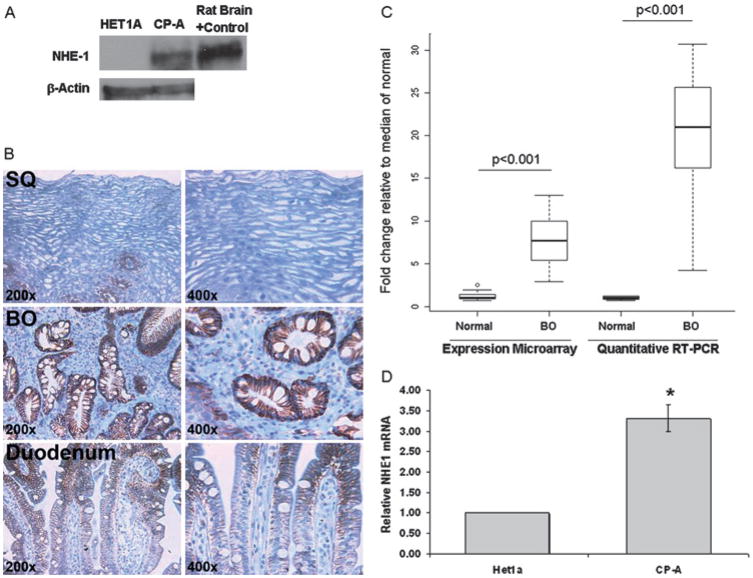
Results: A dose dependent decrease in pH(i) was observed in CP-A cells exposed to BA. This effect of BA is the consequence of NOS activation and increased NO production, which leads to NHE inhibition. Exposure of oesophageal cells to acid in combination with BA synergistically decreased pH(i). The decrease was more pronounced in CP-A cells and resulted in >2-fold increase in DNA damage compared to acid treatment alone. Examination of biopsies and cell lines revealed robust expression of NHE1 in Barrett's oesophagus but an absence of NHE1 in normal epithelium.

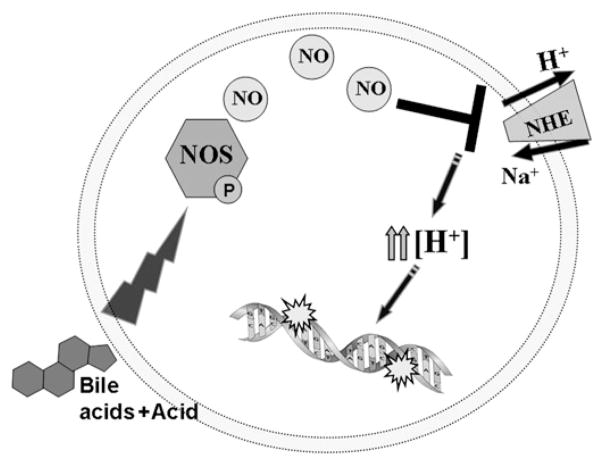
Conclusions: The results of this study identify a new mechanism of bile acid-induced DNA damage. We found that bile acids present in the refluxate activate immediately all three isoforms of NOS, which leads to an increased NO production and NHE inhibition. This consequently results in increased intracellular acidification and DNA damage, which may lead to mutations and cancer progression. Therefore, we propose that in addition to gastric reflux, bile reflux should be controlled in patients with Barrett's oesophagus.


Conflict of interest statement

Competing interests None.

Figures

Figure 1
Figure 1
Bile acid cocktail (BA) induces intracellular acidification that is mediated by nitric oxide. (A) The Delta;pHi after exposure to 0.5 mM BA in the absence or presence of the nitric oxide synthase (NOS) inhibitors NG-nitro-L-arginine methyl ester (L-NAME) and 1400W. (##p<0.01 compared with baseline, **p<0.01, ***p<0.001 compared with 0.5 mM BA). (B) Representative pHi traces in CP-A cells measured by BCECF microfluorimetry. The vertical transparent red box indicates values used to quantify Delta;pHi. The results are mean±SEM from at least three independent experiments. BCECF, 2′,7′-bis(carboxyethyl)-5(6)-carboxyfluorescein.
Figure 2
Figure 2
Increased nitric oxide (NO) production and nitric oxide synthase (NOS) activation is induced by bile acid cocktail (BA). CP-A cells were exposed to 0.5 mM BA in the presence or absence of the NOS inhibitors NG-nitro-L-arginine methyl ester (L-NAME) and 1400W. (A) Relative DAF-FM fluorescence after 1 min treatments at excitation/emission wavelengths 490/535 nm. The results represent mean±SEM from at least three independent experiments. (*p<0.05, **p<0.01 compared to pH 5.5 +0.5 mM BA), (#p<0.05 ###p<0.001 compared to pH 7.4). (B) Representative real-time traces of DAF-FM fluorescence. (C) Western blots of phosphorylated eNOS and nNOS and β-actin in CP-A cells +/− 0.5 mM BA for 5 min. (D) The presence of phosphorylated iNOS in CP-A cells treated with 0.5 mM BA detected by immunoprecipitation with iNOS antibody and blotting with iNOS or phospho-Ser/Thr/Tyr antibody.
Figure 3
Figure 3
Bile acids induce acidification that is mediated by inhibition of the sodium–hydrogen exchanger (NHE). (A) BA-induced changes in pHi (Delta;pHi) in CP-A cells at 10 min of treatment. The results show mean±SEM of data from at least three independent experiments. (##p<0.01, ###p<0.001 compared to baseline, *p<0.05, **p<0.01, ***p<0.001 compared to 0.5 mM BA). (B) Representative pHi traces demonstrating the effect of 0.5 mM BA +/− the NHE inhibitor DMA and +/− the NOS inhibitors NG-nitro-L-arginine methyl ester (L-NAME) and 1400W. The vertical transparent red box indicates values used to quantify Delta;pHi. Data are representative of at least three independent experiments. BA, bile acid cocktail; DMA, dimethyl amiloride.
Figure 4
Figure 4
Bile acids in combination with acid induce acidification that is mediated by inhibition of the sodium–hydrogen exchanger (NHE). (A) Representative traces of CP-A cells perfused with medium at pH 5.5 with and without 0.5 mM BA with and without NHE inhibitors; dashed line represents extracellular pH (pHe). (B) Recovery (pHi change over time) in CP-A cells after treatment with acid (pH 5.5) and 0.5 mM BA with and without NHE inhibitors. The data represent mean±SEM from more than three independent experiments (*p<0.05, ***p<0.001, compared to pH 5.5 +0.5 mM BA).
Figure 5
Figure 5
Inhibition of nitric oxide synthase (NOS) abrogates acidification induced by acid (pH 5.5) and bile acid cocktail (BA). (A) pHimin in HET1A and CP-A cells in the presence of acid (pH 5.5) +/− bile acids in the presence or absence of NOS inhibitors. (B) Recovery rate (pH change/time) following treatment with acid and bile acids in the presence or absence of NOS inhibitors. (C) Representative pHi traces in CP-A cells measured by BCECF microfluorimetry. The vertical transparent red box indicates values used to quantify pHimin. The cells were perfused for 10 min with (1) acid at pH 5.5 (red line), (2) pH 5.5 and 0.5 mM BA (blue line) and (3) pH 5.5 and 0.5 mM BA in the presence of NOS inhibitors NG-nitro-L-arginine methyl ester (L-NAME) and 1400W (green line). Statistical significance is indicated by asterisks (**p<0.01). Data are representative of at least three separate experiments. BCECF, 2′,7′-bis (carboxyethyl)-5(6)-carboxyfluorescein.
Figure 6
Figure 6
Acidification and DNA damage induced by acid and bile acids. (A) Representative pHi traces (pHe 5.5, 4.5, 5.5+0.5 mM BA) in CP-A cells measured by BCECF microfluorimetry. The vertical transparent red box indicates values used to quantify pHimin. (B) pHimin in HET1A and CP-A cells after treatment with medium at varying pHe and at pH 5.5 +0.5 mM BA. Asterisk indicates statistically significant difference compared to pH 5.5 (**p<0.01, ***p<0.001). (C) Median DNA tail moment in CP-A, measured by the comet assay, after 10 min treatment with medium at varying pH (***p<0.001, **p<0.01 compared to pH 5.5). (D) Representative images of γ-H2AX (green signal) in CP-A cells. Red signal represents nuclear staining. (E) Median DNA tail moment in CP-A cells after treatment with medium at pH 5.5, medium at pH 5.5 +0.5 mM BA and medium at pH 5.5 +0.5 mM BA + NOS inhibitors (**p<0.01 compared to pH 5.5+0.5 mM BA). BCECF, 2′,7′-bis(carboxyethyl)-5(6)-carboxyfluorescein.
Figure 7
Figure 7
Evaluation of NHE1 in oesophageal cell lines and in human tissues. (A) A representative western blot of NHE1 and β-actin in HET1A and CP-A cells with rat brain as positive control. (B) Typical immunohistochemical staining of NHE1 in squamous epithelium (SQ), Barrett’s oesophagus (BE) and duodenum. (C) mRNA levels in normal squamous epithelium (SQ, N=13) and Barrett’s oesophagus tissues (N=18). Panel C shows boxplots of NHE1 expression measured by microarray analysis and RT-PCR in normal squamous epithelium (SQ, N=13) and Barrett’s oesophagus tissue (N=18). Results are shown normalised to the median of the normal squamous population for each technology. The p values for significant differences in NHE1 expression are shown. (D) Relative NHE1 mRNA levels in HET1A and CP-A cells.
Figure 8
Figure 8
Scheme of proposed mechanism of bile acid-induced acidification.

Similar articles

Cited by

References

    1. Rastogi A, Puli S, El-Serag HB, et al. Incidence of esophageal adenocarcinoma in patients with Barrett’s oesophagus and high-grade dysplasia: a meta-analysis. Gastrointest Endosc. 2008;67:394–8. - PubMed
    1. Menges M, Muller M, Zeitz M. Increased acid and bile reflux in Barrett’s oesophagus compared to reflux esophagitis, and effect of proton pump inhibitor therapy. Am J Gastroenterol. 2001;96:331–7. - PubMed
    1. Ostrowski J, Mikula M, Karczmarski J, et al. Molecular defense mechanisms of Barrett’s metaplasia estimated by an integrative genomics. J Mol Med. 2007;85:733–43. - PubMed
    1. Lindahl T, Nyberg B. Rate of depurination of native deoxyribonucleic acid. Biochemistry. 1972;11:3610–18. - PubMed
    1. LeBoeuf RA, Kerckaert GA. The induction of transformed-like morphology and enhanced growth in Syrian hamster embryo cells grown at acidic pH. Carcinogenesis. 1986;7:1431–40. - PubMed

Publication types

MeSH terms