

Ancestral grass karyotype reconstruction unravels new mechanisms of genome shuffling as a source of plant evolution
- PMID: 20876790
- PMCID: PMC2963818
- DOI: 10.1101/gr.109744.110
Ancestral grass karyotype reconstruction unravels new mechanisms of genome shuffling as a source of plant evolution
Abstract
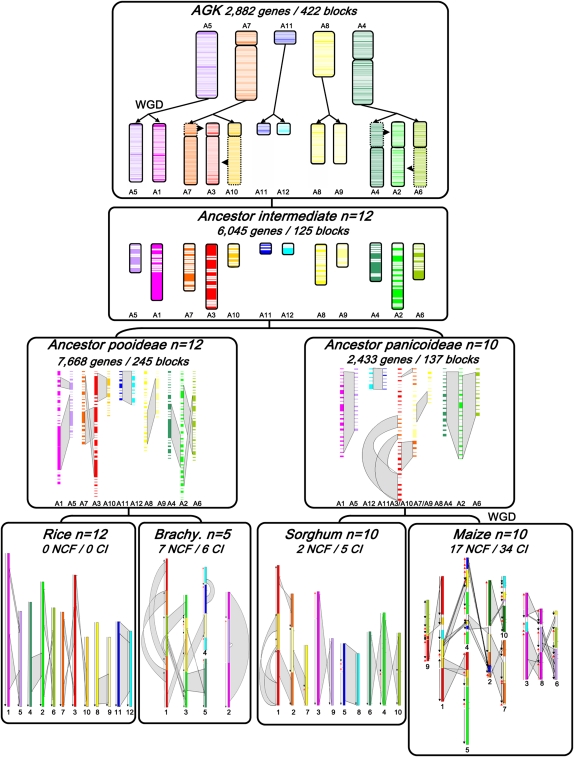
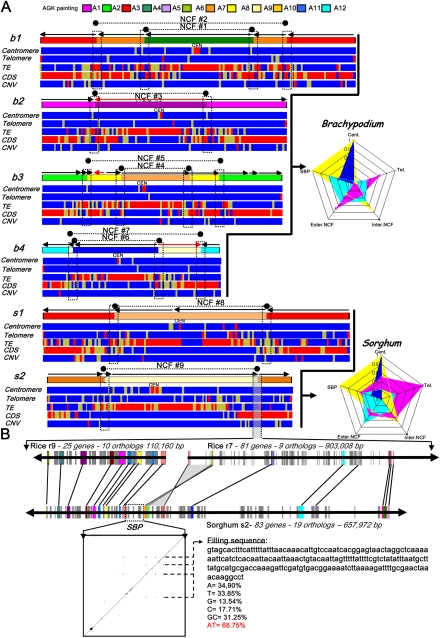
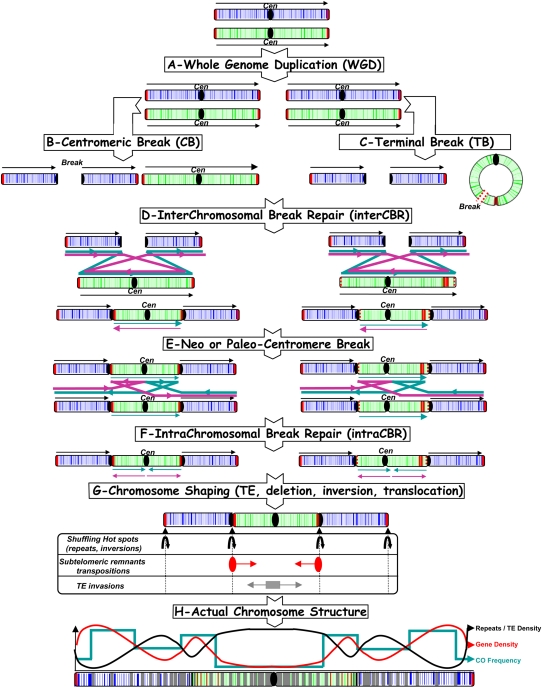
The comparison of the chromosome numbers of today's species with common reconstructed paleo-ancestors has led to intense speculation of how chromosomes have been rearranged over time in mammals. However, similar studies in plants with respect to genome evolution as well as molecular mechanisms leading to mosaic synteny blocks have been lacking due to relevant examples of evolutionary zooms from genomic sequences. Such studies require genomes of species that belong to the same family but are diverged to fall into different subfamilies. Our most important crops belong to the family of the grasses, where a number of genomes have now been sequenced. Based on detailed paleogenomics, using inference from n = 5-12 grass ancestral karyotypes (AGKs) in terms of gene content and order, we delineated sequence intervals comprising a complete set of junction break points of orthologous regions from rice, maize, sorghum, and Brachypodium genomes, representing three different subfamilies and different polyploidization events. By focusing on these sequence intervals, we could show that the chromosome number variation/reduction from the n = 12 common paleo-ancestor was driven by nonrandom centric double-strand break repair events. It appeared that the centromeric/telomeric illegitimate recombination between nonhomologous chromosomes led to nested chromosome fusions (NCFs) and synteny break points (SBPs). When intervals comprising NCFs were compared in their structure, we concluded that SBPs (1) were meiotic recombination hotspots, (2) corresponded to high sequence turnover loci through repeat invasion, and (3) might be considered as hotspots of evolutionary novelty that could act as a reservoir for producing adaptive phenotypes.
Figures
Similar articles
-
Seventy million years of concerted evolution of a homoeologous chromosome pair, in parallel, in major Poaceae lineages.Plant Cell. 2011 Jan;23(1):27-37. doi: 10.1105/tpc.110.080622. Epub 2011 Jan 25. Plant Cell. 2011. PMID: 21266659 Free PMC article.
-
Chromosome identification and reconstruction of evolutionary rearrangements in Brachypodium distachyon, B. stacei and B. hybridum.Ann Bot. 2018 Aug 27;122(3):445-459. doi: 10.1093/aob/mcy086. Ann Bot. 2018. PMID: 29893795 Free PMC article.
-
Comparative transcriptomics of three Poaceae species reveals patterns of gene expression evolution.Plant J. 2012 Aug;71(3):492-502. doi: 10.1111/j.1365-313X.2012.05005.x. Epub 2012 Jun 5. Plant J. 2012. PMID: 22443345
-
The 'inner circle' of the cereal genomes.Curr Opin Plant Biol. 2009 Apr;12(2):119-25. doi: 10.1016/j.pbi.2008.10.011. Epub 2008 Dec 16. Curr Opin Plant Biol. 2009. PMID: 19095493 Review.
-
Comparative genomics in the grass family: molecular characterization of grass genome structure and evolution.Ann Bot. 2002 Jan;89(1):3-10. doi: 10.1093/aob/mcf008. Ann Bot. 2002. PMID: 12096816 Free PMC article. Review.
Cited by
-
Interspecific analysis of diurnal gene regulation in panicoid grasses identifies known and novel regulatory motifs.BMC Genomics. 2020 Jun 25;21(1):428. doi: 10.1186/s12864-020-06824-3. BMC Genomics. 2020. PMID: 32586356 Free PMC article.
-
IAGS: Inferring Ancestor Genome Structure under a Wide Range of Evolutionary Scenarios.Mol Biol Evol. 2022 Mar 2;39(3):msac041. doi: 10.1093/molbev/msac041. Mol Biol Evol. 2022. PMID: 35176153 Free PMC article.
-
Development of new cytogenetic markers for Thinopyrum ponticum (Podp.) Z.-W. Liu & R.-C. Wang.Comp Cytogenet. 2019 Aug 13;13(3):231-243. doi: 10.3897/CompCytogen.v13i3.36112. eCollection 2019. Comp Cytogenet. 2019. PMID: 31440353 Free PMC article.
-
Barbara McClintock's Unsolved Chromosomal Mysteries: Parallels to Common Rearrangements and Karyotype Evolution.Plant Cell. 2018 Apr;30(4):771-779. doi: 10.1105/tpc.17.00989. Epub 2018 Mar 15. Plant Cell. 2018. PMID: 29545470 Free PMC article.
-
GGDB: A Grameneae genome alignment database of homologous genes hierarchically related to evolutionary events.Plant Physiol. 2022 Aug 29;190(1):340-351. doi: 10.1093/plphys/kiac297. Plant Physiol. 2022. PMID: 35789395 Free PMC article.
References
-
- Blitzblau HG, Bell GW, Rodriguez J, Bell SP, Hochwagen A 2007. Mapping of meiotic single-stranded DNA reveals double-stranded-break hotspots near centromeres and telomeres. Curr Biol 17: 2003–2012 - PubMed
-
- Bolot S, Abrouk M, Masood-Quraishi U, Stein N, Messing J, Feuillet C, Salse J 2009. The “inner circle” of the cereal genomes. Curr Opin Plant Biol 12: 119–125 - PubMed
Publication types
MeSH terms
LinkOut - more resources
Full Text Sources
Other Literature Sources