. 2010 Nov;16(11):2170-80.
doi: 10.1261/rna.2225110. Epub 2010 Sep 28.

Complexity of the microRNA repertoire revealed by next-generation sequencing

Affiliations

Complexity of the microRNA repertoire revealed by next-generation sequencing

Lik Wee Lee et al. RNA. 2010 Nov.

Abstract

MicroRNAs (miRNAs) have been implicated to play key roles in normal physiological functions, and altered expression of specific miRNAs has been associated with a number of diseases. It is of great interest to understand their roles and a prerequisite for such study is the ability to comprehensively and accurately assess the levels of the entire repertoire of miRNAs in a given sample. It has been shown that some miRNAs frequently have sequence variations termed isomirs. To better understand the extent of miRNA sequence heterogeneity and its potential implications for miRNA function and measurement, we conducted a comprehensive survey of miRNA sequence variations from human and mouse samples using next generation sequencing platforms. Our results suggest that the process of generating this isomir spectrum might not be random and that heterogeneity at the ends of miRNA affects the consistency and accuracy of miRNA level measurement. In addition, we have constructed a database from our sequencing data that catalogs the entire repertoire of miRNA sequences (http://galas.systemsbiology.net/cgi-bin/isomir/find.pl). This enables users to determine the most abundant sequence and the degree of heterogeneity for each individual miRNA species. This information will be useful both to better understand the functions of isomirs and to improve probe or primer design for miRNA detection and measurement.


Figures

FIGURE 1.
FIGURE 1.
The observed miRNA length distrribution. The most abundant miRNA sequence length distribution for (A) human and (B) mouse samples compared to miRNA sequences deposited in miRBase. The x-axis represents different length of miRNA sequences and the observed frequencies are displayed on y-axis. The higher percentage of miRNA with longer dominant sequence length compared to miRBase sequences suggest that degradation products are unlikely to explain a considerable fraction of the isomirs observed.
FIGURE 2.
FIGURE 2.
The distribution of spike-in RNA ends observed through NextGen sequencing results. The individual end nucleotides are listed on the x-axis and the frequency of observed individual ends are displayed on the y-axis. The full-length RNA oligonucleotide ends are listed as bold-face characters. The 3′ end of sequencing reads matches exactly to the synthetic RNA while the 5′ end variation seen are likely to be premature termination during the spike-in artificial RNA synthesis.
FIGURE 3.
FIGURE 3.
The distribution of selected miRNA ends observed through NextGen sequencing results: (A) mir-24, (B) mir-21, (C) mir-140-3p, (D) mir-30, (E) mir-30*. The individual end nucleotides are listed on the x-axis and the frequency of observed individual ends are displayed on the y-axis. The ends corresponding to the miRNA sequence listed in miRBase are shown in red. (A) The 3′ ends of miR-24 mostly match the miRBase sequence, (B) but for miR-21, it varies by samples. (C) mir-140-3p: The 5′ ends are not always as conserved as in (A) mir-24 and (B) mir-21 and the 3′ ends mostly do not match the miRBase sequence. Both arms of the miRNA precusor, (D) mir-30a and (E) mir-30a*, have fairly conserved 5′ ends while the 3′ ends are more diverse.
FIGURE 4.
FIGURE 4.
Different plot of the distribution of selected miRNA ends observed through NextGen sequencing results: (A) mir-24, (B) mir-21, (C) mir-140-3p, (D) mir-30, (E) mir-30*. The data are the same as shown in Figure 3, but the lines are offset so that the changes in different samples can be distinguished.
FIGURE 5.
FIGURE 5.
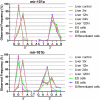
The distribution of mir-101a and mir-101b ends observed through NextGen sequencing results. The individual end nucleotides are listed on the x-axis and the frequency of observed individual ends are displayed on the y-axis. The ends corresponding to the miRNA sequence listed in miRBase are listed as red characters. Both mir-101a and mir-101b show two distinct 5′ ends. Samples from the ES differentiation experiments end with G while liver samples end with T. The majority of 3′ end for mir-101a matches the database at A, while for mir-101b, the liver samples are spread in two major ends, one nucleotide shorter (A) or one nucleotide longer (G) compared to the ES samples.
FIGURE 6.
FIGURE 6.
Different plot of the distribution of mir-101a and mir-101b ends observed through NextGen sequencing results. The data are the same as shown in Figure 5 but the lines are offset so that the changes in different samples can be distinguished.
FIGURE 7.
FIGURE 7.
The effects of miRNA end region heterogenity on different miRNA qPCR platforms. QPCR reagents from three different vendors, Qiagen (black bars), Exiqon (gray bars), and ABI (white bars), are used to assess its ability to detect same amount of synthetic RNA sequences based on the isomirs from (A) mir-451 and (B) mir-18a. The detection efficiency was compared to the detection efficiency of the database sequence and shows that one- or two-nucleotide-length difference in miRNA can drastically affect measurement results.
FIGURE 8.
FIGURE 8.
A screen shot of isomir database. The aligned reads and corresponding counts are shown. The first plot shows the frequency of the bases and the second plot shows the frequency of the mature miRNA end positions. Sequences that match perfectly to miRBase sequences are shown underlined (pink in Supplemental Fig. S1 and online database) and most abundant sequences are displayed in bold.

References

    1. Ach RA, Wang H, Curry B 2008. Measuring microRNAs: Comparisons of microarray and quantitative PCR measurements, and of different total RNA prep methods. BMC Biotechnol 8: 69 doi: 10.1186/1472-6750-8-69 - PMC - PubMed
    1. Ansorge WJ 2009. Next-generation DNA sequencing techniques. New Biotechnol 25: 195–203 - PubMed
    1. Bargaje R, Hariharan M, Scaria V, Pillai B 2010. Consensus miRNA expression profiles derived from interplatform normalization of microarray data. RNA 16: 16–25 - PMC - PubMed
    1. Barroso-del Jesus A, Lucena-Aguilar G, Menendez P 2009The miR-302-367 cluster as a potential stemness regulator in ESCs. Cell Cycle 8: 394–398 - PubMed
    1. Chang J, Nicolas E, Marks D, Sander C, Lerro A, Buendia MA, Xu C, Mason WS, Moloshok T, Bort R, et al. 2004. miR-122, a mammalian liver-specific microRNA, is processed from hcr mRNA and may downregulate the high affinity cationic amino acid transporter CAT-1. RNA Biol 1: 106–113 - PubMed

Publication types

LinkOut - more resources