

Contrast-enhanced diagnostic ultrasound causes renal tissue damage in a porcine model
- PMID: 20876892
- PMCID: PMC2948414
- DOI: 10.7863/jum.2010.29.10.1391
Contrast-enhanced diagnostic ultrasound causes renal tissue damage in a porcine model
Abstract
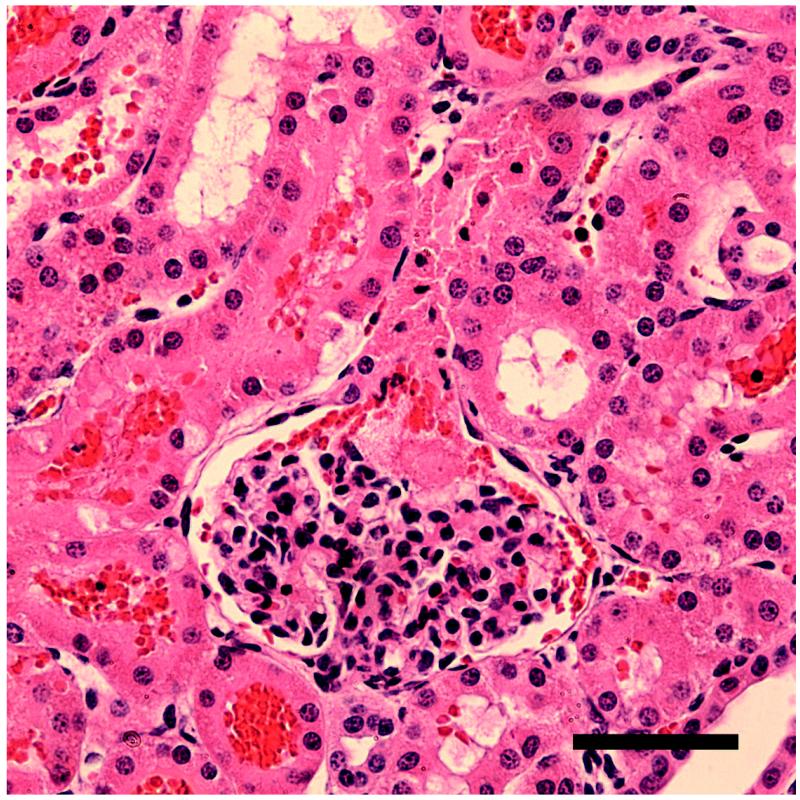
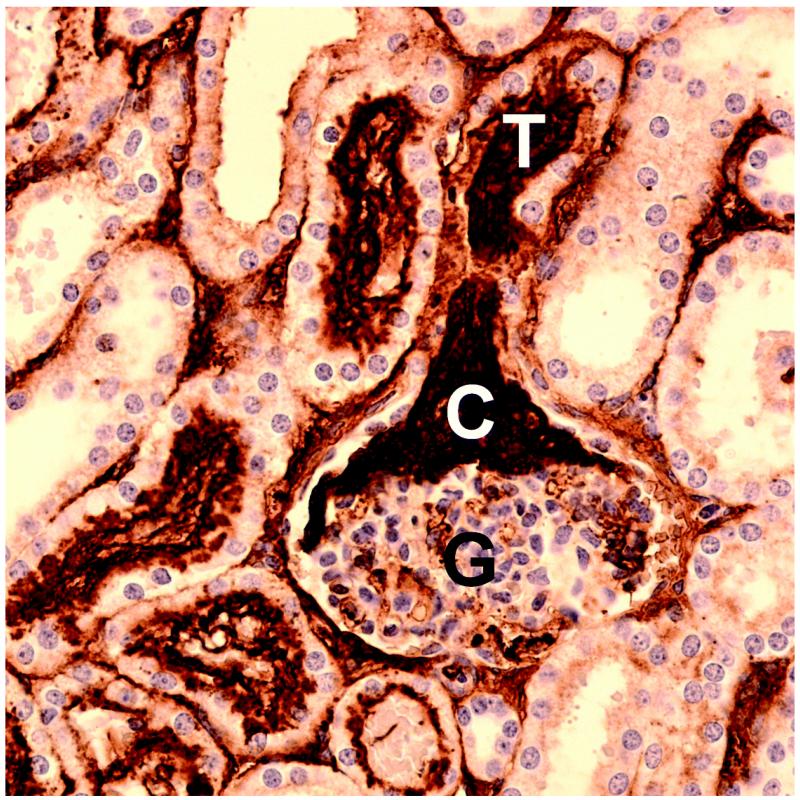
Objective: Glomerular capillary hemorrhage (GCH) has been reported and confirmed as a consequence of contrast-enhanced diagnostic ultrasound (CEDUS) imaging of rat kidney. This study assessed renal tissue injury in the larger porcine model.
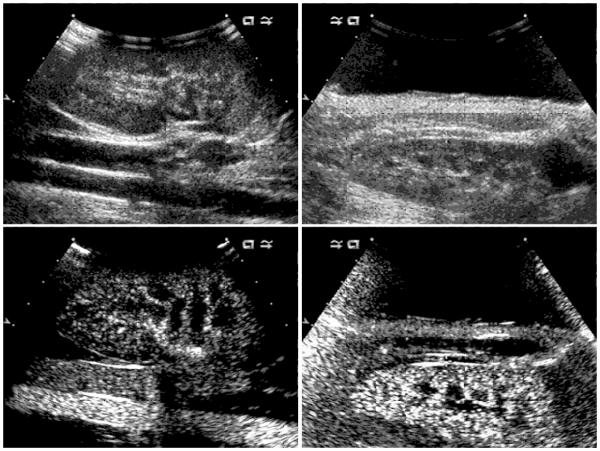
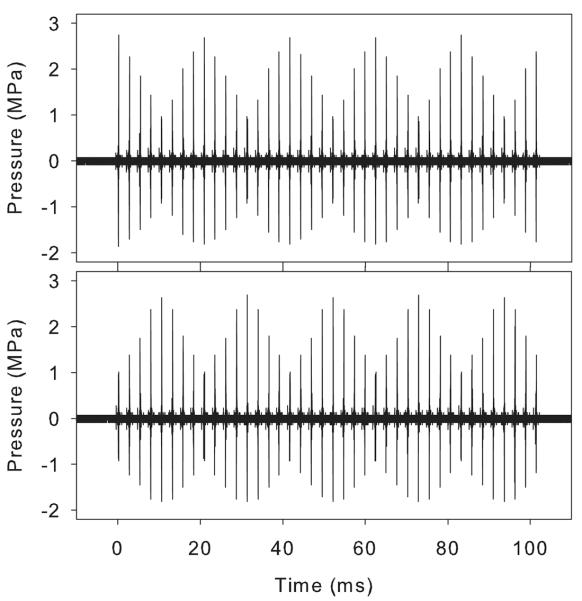
Methods: The right kidneys of anesthetized pigs were imaged in 8 groups of 4 pigs. A Vingmed System Five ultrasound machine (General Electric Co, Cincinnati, OH) was used at 1.5 MHz in the B-mode to intermittently scan the kidney at 4-second intervals. An Acuson Sequoia 512 machine (Siemens Medical Solutions, Mountain View, CA) was used in the 1.5-MHz Cadence contrast pulse sequencing mode with intermittent agent clearance bursts at 4-second intervals. Kidneys were scanned transabdominally or after laparotomy through a saline standoff. The second machine's probe was placed in contact with the kidney for 1 group. A perflutren lipid microsphere contrast agent (Definity; Lantheus Medical Imaging, Inc, North Billerica, MA) was infused at 4 μL/kg/min (diluted 33:1 in saline) for 4 minutes during scanning.
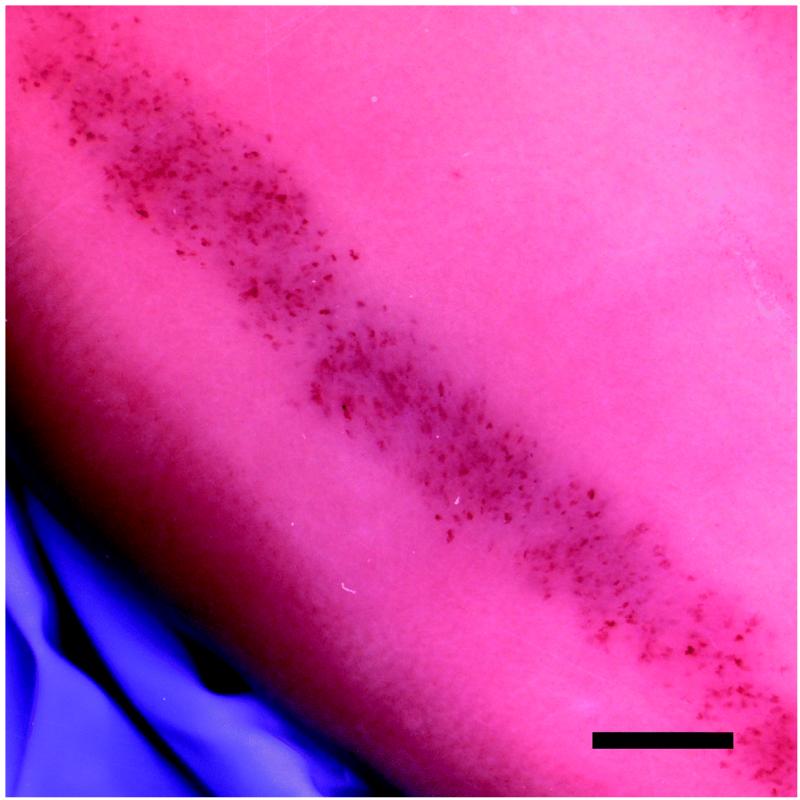
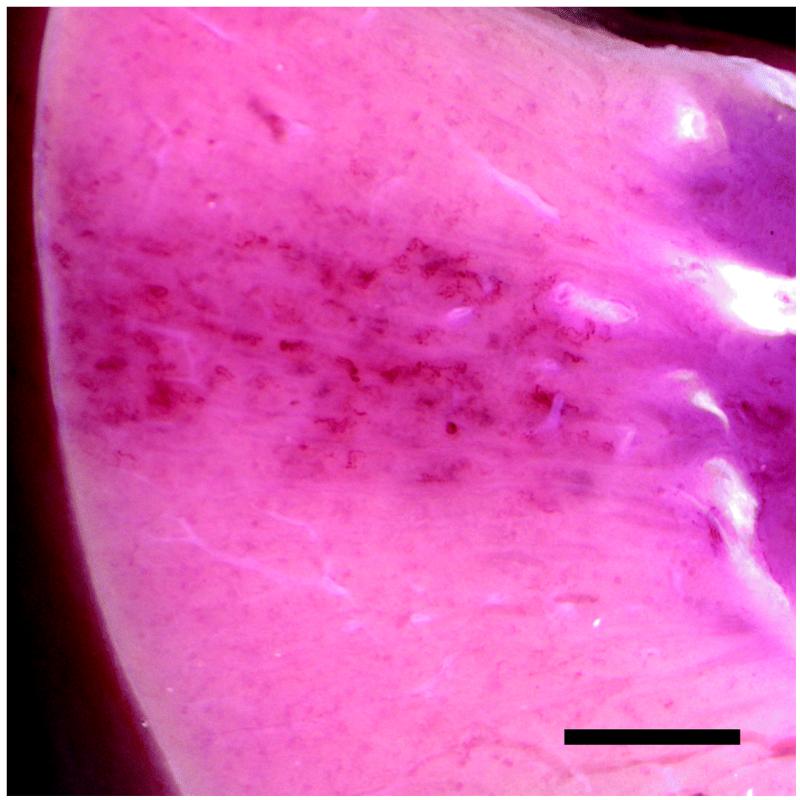
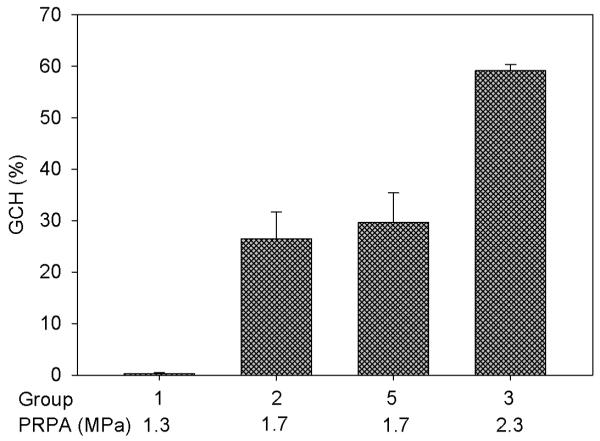
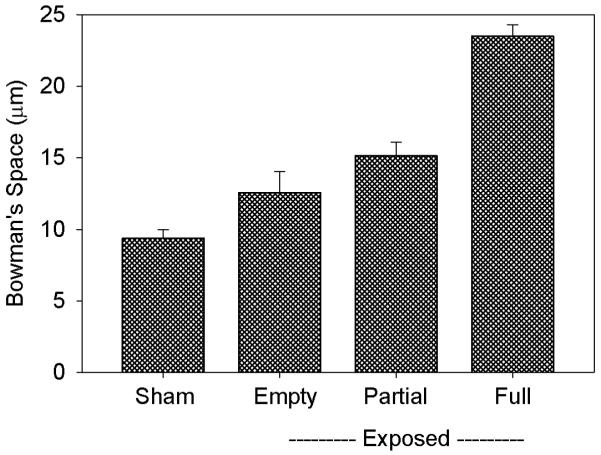
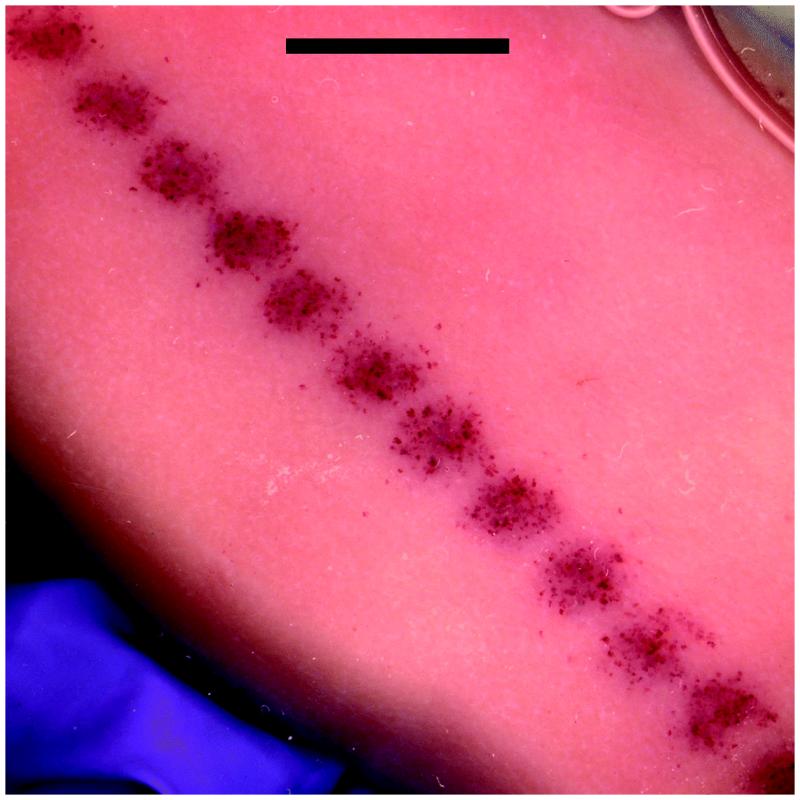
Results: Blood-filled urinary tubules were evident on the kidney surface for all groups except the group with the probe in contact with the kidney. Glomerular capillary hemorrhage was found by histologic processing in 31.7% ± 9.8% (mean ± SD) of glomeruli in the center of the scan plane for 1.7-MPa transabdominal scanning and 1.5% ± 2.9% of glomeruli in sham samples (P < .05). In addition, hematuria was detected after scanning, and tubular obstruction occurred in some nephrons.
Conclusions: Renal tissue damage was induced by CEDUS in the porcine model. This result, together with previous studies in rats, support a hypothesis that GCH would occur in humans from similar CEDUS exposure.
Figures
Similar articles
-
Glomerular capillary hemorrhage induced in rats by diagnostic ultrasound with gas-body contrast agent produces intratubular obstruction.Ultrasound Med Biol. 2009 May;35(5):869-77. doi: 10.1016/j.ultrasmedbio.2008.10.015. Epub 2009 Jan 18. Ultrasound Med Biol. 2009. PMID: 19152998 Free PMC article.
-
Doppler mode pulse sequences mitigate glomerular capillary hemorrhage in contrast-aided diagnostic ultrasound of rat kidney.IEEE Trans Ultrason Ferroelectr Freq Control. 2007 Sep;54(9):1802-10. doi: 10.1109/tuffc.2007.464. IEEE Trans Ultrason Ferroelectr Freq Control. 2007. PMID: 17941386
-
Do Anesthetic Techniques Influence the Threshold for Glomerular Capillary Hemorrhage Induced in Rats by Contrast-Enhanced Diagnostic Ultrasound?J Ultrasound Med. 2016 Feb;35(2):373-80. doi: 10.7863/ultra.15.05015. Epub 2016 Jan 13. J Ultrasound Med. 2016. PMID: 26764276 Free PMC article.
-
Ultrasound contrast agents: balancing safety versus efficacy.Expert Opin Drug Saf. 2009 Jan;8(1):49-56. doi: 10.1517/14740330802658581. Expert Opin Drug Saf. 2009. PMID: 19236217 Review.
-
Contrast-enhanced ultrasound of the liver and kidney.Radiol Clin North Am. 2014 Nov;52(6):1177-90. doi: 10.1016/j.rcl.2014.07.005. Epub 2014 Sep 10. Radiol Clin North Am. 2014. PMID: 25444099 Review.
Cited by
-
A theoretical study of inertial cavitation from acoustic radiation force impulse imaging and implications for the mechanical index.Ultrasound Med Biol. 2015 Feb;41(2):472-85. doi: 10.1016/j.ultrasmedbio.2014.09.012. Ultrasound Med Biol. 2015. PMID: 25592457 Free PMC article.
-
Contrast-enhanced ultrasound analysis of renal perfusion in normal micropigs.J Vet Sci. 2012 Sep;13(3):311-4. doi: 10.4142/jvs.2012.13.3.311. J Vet Sci. 2012. PMID: 23000588 Free PMC article.
-
Management of Indeterminate Cystic Kidney Lesions: Review of Contrast-enhanced Ultrasound as a Diagnostic Tool.Urology. 2016 Jan;87:1-10. doi: 10.1016/j.urology.2015.10.002. Epub 2015 Oct 19. Urology. 2016. PMID: 26483268 Free PMC article. Review.
-
An Introduction to Contrast-Enhanced Ultrasound for Nephrologists.Nephron. 2018;138(3):176-185. doi: 10.1159/000484635. Epub 2017 Nov 9. Nephron. 2018. PMID: 29131073 Free PMC article. Review.
-
Breast tumor response to ultrasound mediated excitation of microbubbles and radiation therapy in vivo.Oncoscience. 2016 Mar 24;3(3-4):98-108. doi: 10.18632/oncoscience.299. eCollection 2016. Oncoscience. 2016. PMID: 27226983 Free PMC article.
References
-
- Averkiou M, Powers J, Skyba D, Bruce M, Jensen S. Ultrasound contrast imaging research. Ultrasound Q. 2003;19:27–37. - PubMed
-
- Miller DL, Averkiou MA, Brayman AA, et al. Bioeffects considerations for diagnostic ultrasound contrast agents. J Ultrasound Med. 2008;27:611–632. - PubMed
-
- Wible JH, Jr, Galen KP, Wojdyla JK, Hughes MS, Klibanov AL, Brandenburger GH. Microbubbles induce renal hemorrhage when exposed to diagnostic ultrasound in anesthetized rats. Ultrasound Med Biol. 2002;28:1535–1546. - PubMed
-
- Miller DL, Dou C, Wiggins RC, Wharram BL, Goyal M, Williams AR. An in vivo rat model simulating imaging of human kidney by diagnostic ultrasound with gas-body contrast agent. Ultrasound Med Biol. 2007;33:129–135. - PubMed
Publication types
MeSH terms
Substances
Grants and funding
LinkOut - more resources
Full Text Sources
Medical
