. 2010 Oct;120(10):3466-79.
doi: 10.1172/JCI42845. Epub 2010 Sep 27.

Weight loss and lipolysis promote a dynamic immune response in murine adipose tissue

Affiliations

Weight loss and lipolysis promote a dynamic immune response in murine adipose tissue

Aliki Kosteli et al. J Clin Invest. 2010 Oct.

Abstract

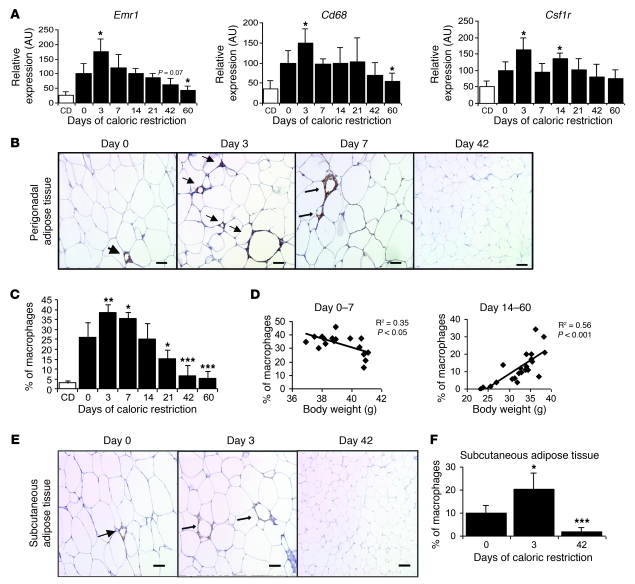
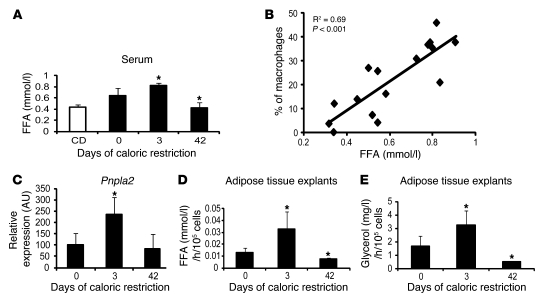
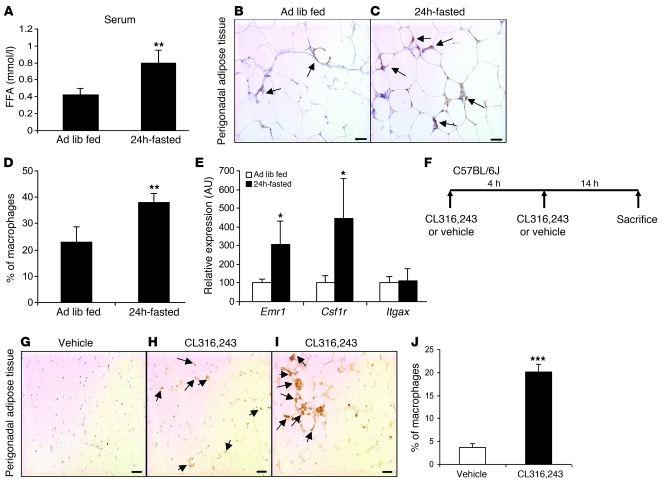
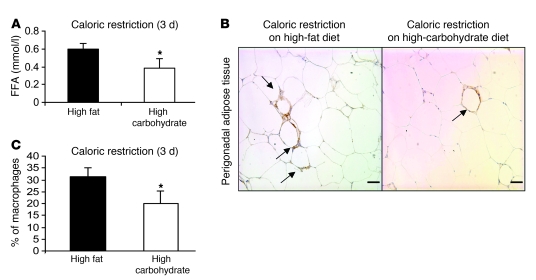
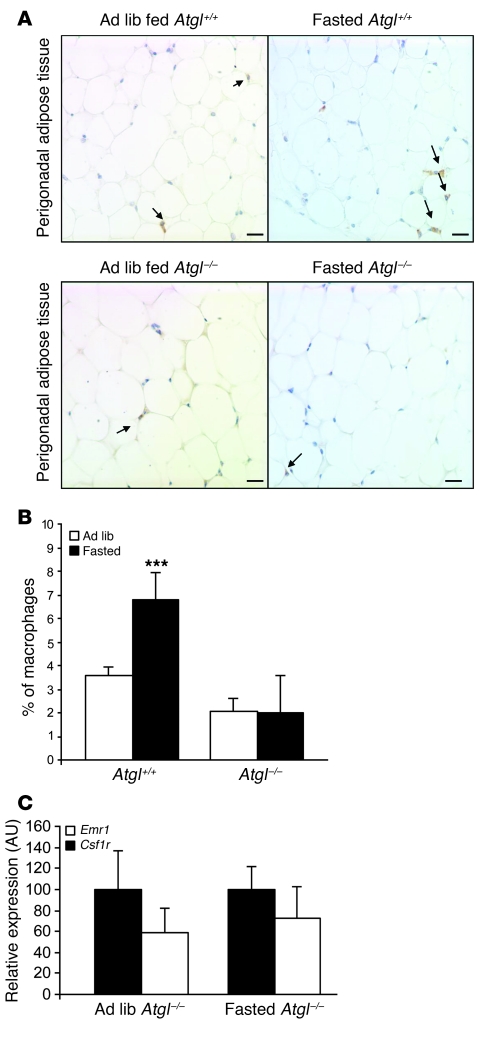
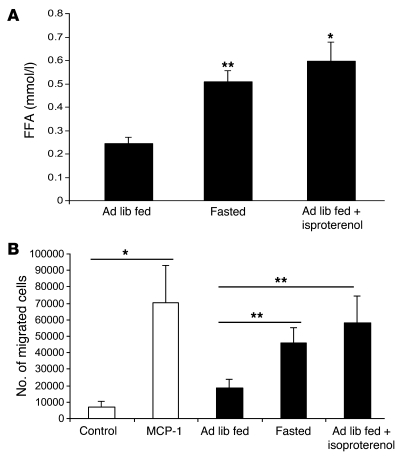
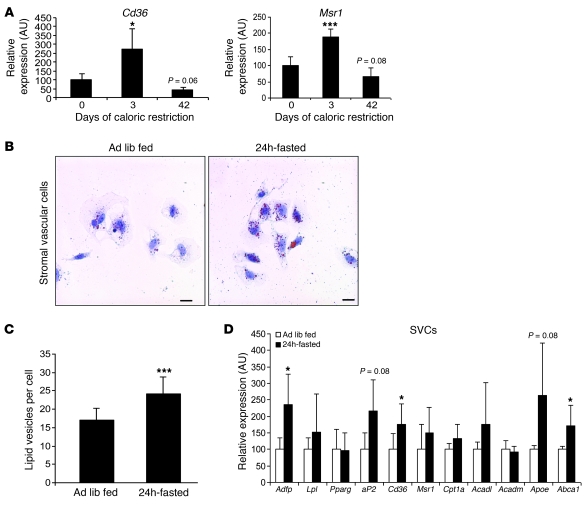
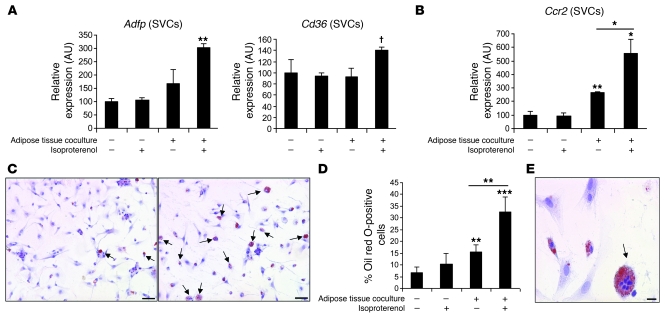
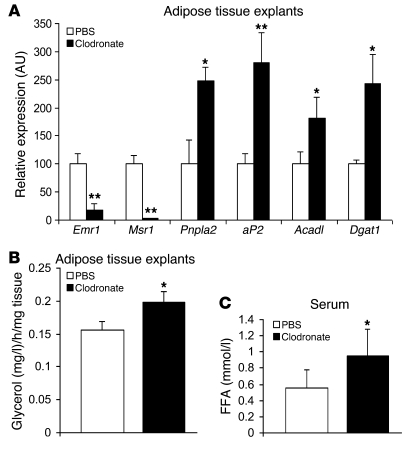
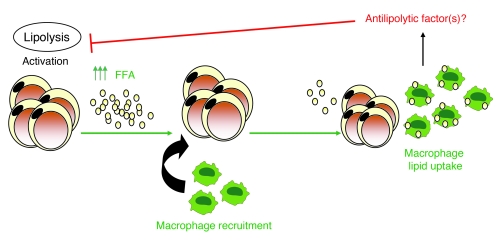
Obesity elicits an immune response characterized by myeloid cell recruitment to key metabolic organs, including adipose tissue. However, the response of immune cells to nonpathologic metabolic stimuli has been less well studied, and the factors that regulate the metabolic-dependent accumulation of immune cells are incompletely understood. Here we characterized the response of adipose tissue macrophages (ATMs) to weight loss and fasting in mice and identified a role for lipolysis in ATM recruitment and accumulation. We found that the immune response to weight loss was dynamic; caloric restriction of high-fat diet-fed mice led to an initial increase in ATM recruitment, whereas ATM content decreased following an extended period of weight loss. The peak in ATM number coincided with the peak in the circulating concentrations of FFA and adipose tissue lipolysis, suggesting that lipolysis drives ATM accumulation. Indeed, fasting or pharmacologically induced lipolysis rapidly increased ATM accumulation, adipose tissue chemoattractant activity, and lipid uptake by ATMs. Conversely, dietary and genetic manipulations that reduced lipolysis decreased ATM accumulation. Depletion of macrophages in adipose tissue cultures increased expression of adipose triglyceride lipase and genes regulated by FFA, and increased lipolysis. These data suggest that local lipid fluxes are central regulators of ATM recruitment and that once recruited, ATMs form lipid-laden macrophages that can buffer local increases in lipid concentration.


Figures

Figure 1
Figure 1. ATM content increases, then decreases during weight loss.
(A) Expression of genes encoding myeloid-macrophage proteins in perigonadal adipose tissue. Black bars represent high-fat diet–induced obese mice that underwent caloric restriction for different time intervals. White bars represent control lean mice that were fed a chow diet (CD) and did not undergo caloric restriction. n = 5–6 mice/group. (B) Immunohistochemical staining of F4/80-expressing (EMR1) macrophages in perigonadal adipose tissue sections from mice during weight loss following indicated number of days of caloric restriction. Arrows indicate ATMs. Scale bars: 50 μm. (C) Macrophages as a percentage of all cells in perigonadal adipose tissue. n = 5–6 mice/group. (D) Relationship between macrophage content and body weight in mice during the first 7 days of weight loss (left panel) and during days 14–60 of weight loss (right panel). The square values of the Pearson’s correlation coefficients are shown. Each data point represents the % of macrophages in murine perigonadal adipose tissue at different body weights during caloric restriction. (E) Immunohistochemical staining of F4/80-expressing macrophages (EMR1) in subcutaneous adipose tissue sections. Scale bars: 50 μm. (F) Macrophages as a percentage of all cells in subcutaneous adipose tissue from mice during weight loss. n = 5–6 mice/group. All data are represented as mean ± SD. *P < 0.05; **P < 0.01; ***P < 0.001, versus day 0.
Figure 2
Figure 2. Measures of lipolysis correlate with ATM content.
(A) Serum concentrations of FFA during weight loss induced by caloric restriction. Black bars represent high-fat diet–induced obese mice that underwent caloric restriction for different time intervals. White bar represents control lean mice that were fed a chow diet and did not undergo caloric restriction. n = 5–6 mice/group. (B) Correlation of macrophage content (% macrophages) and serum FFA concentration in mice during weight loss; the square value of the Pearson’s correlation coefficient is shown. n = 5–6 mice/group. Each data point represents the % of macrophages in murine perigonadal adipose tissue at different serum FFA concentrations. (C) Perigonadal adipose tissue expression of the gene encoding the lipase ATGL in mice during weight loss induced by caloric restriction. n = 5–6 mice/group. (D) FFA release from explants of perigonadal adipose tissue incubated under basal conditions. Explants were isolated from high-fat diet–induced obese mice that were ad libitum fed or underwent caloric restriction for 3 or 42 days. (E) Glycerol release from explants of perigonadal adipose tissue incubated under basal conditions. Explants were isolated from high-fat diet–induced obese mice that were ad libitum fed or underwent caloric restriction for 3 or 42 days. All data are represented as mean ± SD. *P < 0.05, versus day 0.
Figure 3
Figure 3. Induction of lipolysis increases macrophage content in adipose tissue.
(A) Serum concentrations of FFA in high-fat diet–induced obese ad libitum–fed and 24 hour–fasted mice. n = 5–6 mice/group. **P < 0.01, versus ad libitum fed (Ad lib fed). (B and C) Immunohistochemical staining of F4/80-expressing (EMR1) macrophages in perigonadal adipose tissue sections from high-fat diet–induced obese ad libitum fed (B) and 24 hour-fasted mice (C). Arrows indicate ATMs. Scale bars: 50 μm. (D) Macrophages as percentage of all cells in perigonadal adipose tissue from high-fat diet–induced obese ad libitum–fed and 24 hour–fasted mice. n = 5–6 mice/group. **P < 0.01, versus ad libitum fed. (E) Expression of genes encoding myeloid-macrophage–specific proteins in lean ad libitum–fed and 24 hour–fasted mice. n = 5–6 mice/group. *P < 0.05, versus ad libitum fed. (F) Protocol for pharmacologically induced adipocyte lipolysis through β3-adrenergic agonist (CL316,243) in lean mice. (GI) Immunohistochemical staining of F4/80-expressing (EMR1) macrophages in perigonadal adipose tissue sections from lean mice treated with vehicle (G) or with CL316,243 (H and I). Multinucleated giant cells containing lipid droplets are apparent in some sections (I). Arrows indicate ATMs. Scale bars: 50 μm. (J) Macrophages as a percentage of all cells in perigonadal adipose tissue from vehicle- and CL316,243-treated mice. n = 5 mice/group. ***P < 0.001, versus vehicle. All data are represented as mean ± SD.
Figure 4
Figure 4. Lipolysis inhibition through dietary manipulation limits ATM accumulation during early weight loss.
A caloric restriction protocol was used to induce weight loss with lower rates of lipolysis compared with caloric restriction of mice on a high-fat diet. High-fat diet–induced obese mice were fed 70% of their ad libitum caloric intake for 3 days in the form of either a diet high in carbohydrate or fat content. (A) Serum FFA in mice during weight loss induced by caloric restriction on a diet high in either fat or carbohydrate content. n = 5–6 mice/group. (B) Perigonadal adipose tissue sections from mice during weight loss induced by a diet high in fat (left panel) or high in carbohydrate content (right panel). Arrows indicate ATMs. Scale bars: 50 μm. (C) Macrophages as a percentage of all cells in perigonadal adipose tissue from mice during weight loss induced by caloric restriction on a diet high in either fat or carbohydrate content. n = 5–6 mice/group. *P < 0.05, versus calorie restriction on HFD. All data are represented as mean ± SD.
Figure 5
Figure 5. ATGL/PNPLA2 deficiency limits ATM accumulation during fasting.
(A) Immunohistochemical staining of F4/80-expressing (EMR1) macrophages in perigonadal adipose tissue sections from Atgl+/+ (top panel) and Atgl–/– (lower panel) mice that were either ad libitum fed (left) or fasted (right). Arrows indicate ATMs. Scale bars: 100 μm. (B) Macrophages as a percentage of all cells in lean ad libitum–fed Atgl+/+ and fasted Atgl–/– mice. n = 4–5 mice/group. ***P < 0.001, versus ad libitum fed. (C) Expression of macrophage-specific genes in perigonadal adipose tissue of lean ad libitum–fed and fasted Atgl–/– mice. n = 4–5 mice/group. All data are represented as mean ± SD.
Figure 6
Figure 6. Lipolysis induces macrophage migration.
Perigonadal adipose tissue explants were isolated from lean mice that were either ad libitum fed or were fasted for 24 hours. Explants from fasted animals were incubated under basal conditions, whereas explants from ad libitum–fed mice were incubated with or without isoproterenol treatment (10 μM). (A) FFA concentration was measured in the explant-conditioned media. (B) The chemotactic activity of control medium, medium supplemented with MCP-1/CCL2 (50 ng/ml), and explant-conditioned medium were measured using a standard migration assay for BMDMs. Data are represented as mean ± SD. n = 4, 5–8 replicates per sample. *P < 0.05; **P < 0.01.
Figure 7
Figure 7. Fasting acutely induces lipid droplet formation in ATMs.
(A) Adipose tissue expression of genes whose products, CD36 (Cd36) and scavenger receptor A (Msr1), are implicated in lipid uptake by macrophages were measured in perigonadal adipose tissue during weight loss induced by caloric restriction. n = 5–6 mice/group. *P <0.05; ***P < 0.001, versus day 0. (B) Stromal vascular cells (SVCs) isolated from perigonadal adipose tissue of high-fat diet–induced obese mice that were fed ad libitum (left panel) or were fasted for 24 hours (right panel) were stained for neutral lipid with oil red O. Scale bars: 50 μm. (C) Number of lipid droplets in macrophages from perigonadal adipose tissue of high-fat diet–induced obese mice fed ad libitum or fasted for 24 hours. n = 5 mice/group. ***P < 0.001. (D) Expression of genes (in the stromal vascular fraction) encoding proteins involved in lipid uptake, utilization, and export. n = 5 mice/group. *P < 0.05. All data are represented as mean ± SD.
Figure 8
Figure 8. Induction of adipose tissue lipolysis activates lipid uptake by ATMs.
(A) SVCs isolated from perigonadal adipose tissue of high-fat diet–induced obese mice were cultured either alone or with perigonadal adipose tissue pieces (harvested from lean animals) with or without isoproterenol treatment (10 μM) to induce lipolysis in the adipose tissue fraction. The gene expression of Adfp and Cd36 in SVCs was measured. n = 5 mice/group. Data are represented as mean ± SD. (B) The expression of the chemokine receptor Ccr2 was measured in SVCs treated as described in A. Data are represented as mean ± SD. n = 5 mice/group. (C) SVCs treated with isoproterenol cultured alone (left panel) or with adipose tissue (right panel) were stained for neutral lipid with oil red O. Lipid-containing cells are marked with arrows. Scale bars: 50 μm. (D) Percentage of lipid-containing cells among SVCs treated as described in A. n = 5 mice/group. Data are represented as mean ± SD. *P < 0.05; **P < 0.01; ***P < 0.001; P = 0.09. (E) The presence of lipid-laden multinucleated giant cells among SVCs cocultured with adipose tissue in the presence of isoproterenol. Scale bar: 15 μm.
Figure 9
Figure 9. Adipose tissue explants were isolated from high-fat diet–induced obese mice that were fasting for 24 hours.
Subsequently, explants were treated either with liposome-encapsulated clodronate or liposome-encapsulated PBS. Explants from the same mice were treated with both experimental conditions. (A) Gene expression of macrophage-specific genes and genes involved in lipid metabolism in the explants. Data are represented as mean ± SD. n = 4 mice/group. (B) Glycerol release from explants of perigonadal adipose tissue treated either with liposome-encapsulated clodronate or liposome-encapsulated PBS. Liposome-encapsulated clodronate was administered intraperitoneally to lean C57BL/6J mice. Mice were fasted for 24 hours starting on day 3 after injection, and macrophage depletion in perigonadal adipose tissue was confirmed at the end of the fasting period (day 4). Liposome-encapsulated PBS was also administered as control. (C) Serum concentration of FFA in clodronate- or PBS-treated mice after a 24-hour fast. Data are represented as mean ± SD. n = 8 mice/group. *P < 0.05; **P < 0.01, versus PBS treated.
Figure 10
Figure 10. ATM role in lipid trafficking during weight loss and fasting.
Lipolysis activation during early weight loss and fasting increases the local release of FFA (as well as glycerol and other lipolysis byproducts) inducing ATM recruitment. Once recruited, ATMs phagocytose excess lipid and potentially secrete antilipolytic factors that together reduce local concentrations of FFA.

Comment in

References

    1. Feuerer M, et al. Lean, but not obese, fat is enriched for a unique population of regulatory T cells that affect metabolic parameters. Nat Med. 2009;15(8):930–939. doi: 10.1038/nm.2002. - DOI - PMC - PubMed
    1. Weisberg SP, McCann D, Desai M, Rosenbaum M, Leibel RL, Ferrante AW., Jr Obesity is associated with macrophage accumulation in adipose tissue. . J Clin Invest. 2003;112(12):1796–1808. - PMC - PubMed
    1. Ehses JA, et al. Increased Number of Islet-Associated Macrophages in Type 2 Diabetes. Diabetes. 2007;56(9):2356–2370. doi: 10.2337/db06-1650. - DOI - PubMed
    1. Cai D, et al. Local and systemic insulin resistance resulting from hepatic activation of IKK-beta and NF-kappaB. Nat Med. 2005;11(2):183–190. doi: 10.1038/nm1166. - DOI - PMC - PubMed
    1. Xu H, et al. Chronic inflammation in fat plays a crucial role in the development of obesity-related insulin resistance. J Clin Invest. 2003;112(12):1821–1830. - PMC - PubMed

Publication types