. 2010 Oct;120(10):3455-65.
doi: 10.1172/JCI42528. Epub 2010 Sep 27.

Maf promotes osteoblast differentiation in mice by mediating the age-related switch in mesenchymal cell differentiation

Affiliations

Maf promotes osteoblast differentiation in mice by mediating the age-related switch in mesenchymal cell differentiation

Keizo Nishikawa et al. J Clin Invest. 2010 Oct.

Abstract

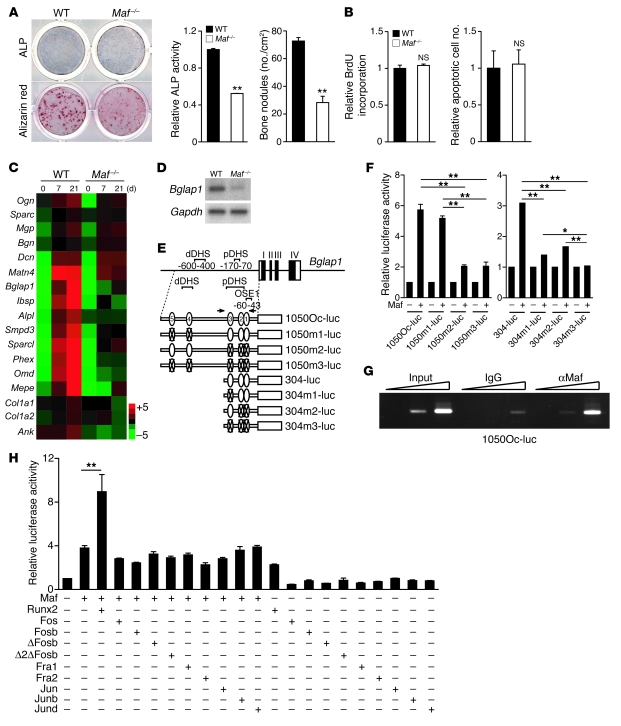
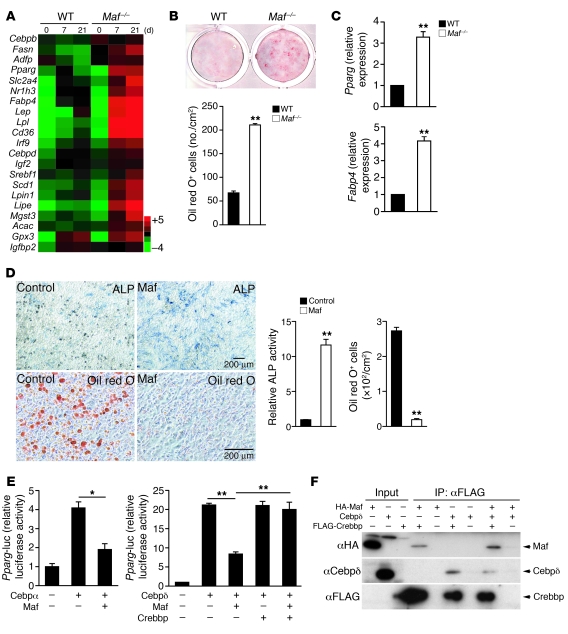
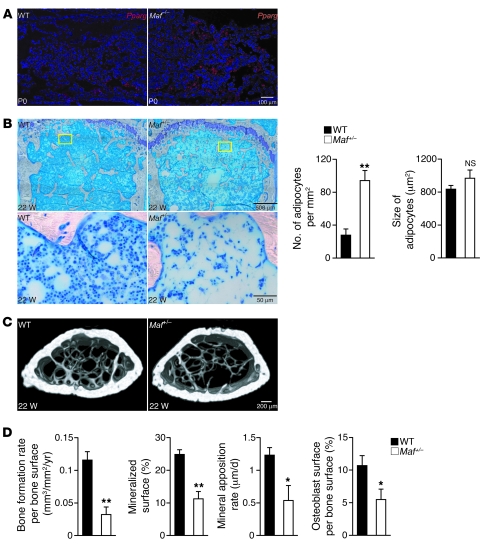
Aging leads to the disruption of the homeostatic balance of multiple biological systems. In bone marrow multipotent mesenchymal cells undergo differentiation into various anchorage-dependent cell types, including osteoblasts and adipocytes. With age as well as with treatment of antidiabetic drugs such as thiazolidinediones, mesenchymal cells favor differentiation into adipocytes, resulting in an increased number of adipocytes and a decreased number of osteoblasts, causing osteoporosis. The mechanism behind this differentiation switch is unknown. Here we show an age-related decrease in the expression of Maf in mouse mesenchymal cells, which regulated mesenchymal cell bifurcation into osteoblasts and adipocytes by cooperating with the osteogenic transcription factor Runx2 and inhibiting the expression of the adipogenic transcription factor Pparg. The crucial role of Maf in both osteogenesis and adipogenesis was underscored by in vivo observations of delayed bone formation in perinatal Maf(-/-) mice and an accelerated formation of fatty marrow associated with bone loss in aged Maf(+/-) mice. This study identifies a transcriptional mechanism for an age-related switch in cell fate determination and may provide a molecular basis for novel therapeutic strategies against age-related bone diseases.


Figures

Figure 1
Figure 1. Impaired bone formation in Maf–/– mice.
(A) A genome-wide screening of transcription factor mRNAs during in vitro differentiation of osteoblasts (OBs) and a comparison of their expression between 8- and 32-week-old BMSCs. The increase in Maf expression during osteoblastogenesis was confirmed in calvarial osteoblasts (RNA blot analysis, right top). Maf expression was markedly lower in BMSCs derived from the aged mice (real-time RT-PCR analysis, right bottom). Screening results are summarized in the Venn diagram. *P < 0.05; **P < 0.01. (B) Alizarin red/alcian blue staining of E17 embryos (top). Top view of calvaria (bottom). Images in B are composites. (C) Histology (von Kossa staining) and microcomputed tomography analysis of WT and Maf–/– littermates at P0 (n = 3). Scale bar: 100 μm. (D) ALP and von Kossa staining of osteogenic fronts (OFs) in the calvaria of WT and Maf–/– littermates. Scale bar: 100 μm. (E) Expression of Bglap1 in the calvaria of WT and Maf–/– mice (in situ hybridization). Scale bar: 100 μm.
Figure 2
Figure 2. Regulation of osteoblast differentiation and Bglap1 expression by Maf in cooperation with Runx2.
(A) ALP and alizarin red staining of WT and Maf–/– calvarial cells. ALP activity and bone nodule formation were quantitated. (B) Proliferation and apoptosis of WT and Maf–/– calvarial cells. (C) mRNA expression of osteoblast-specific genes in WT and Maf–/– calvarial cells (GeneChip analysis). (D) Bglap1 expression in WT and Maf–/– calvarial cells cultured with osteogenic medium for 7 days (RNA blot analysis). (E) Schematic of 5 MARE-like sequences (MARE1–MARE5) in the regulatory region of Bglap1, and Bglap1-luc variants harboring point mutation(s) in MARE-like sequences. pDHS and dDHS indicate proximal and distal DNase hypersensitive sites, respectively (23). Arrows indicate the primer set used for ChIP. Numbers within ovals represent corresponding MARE sequences. Ovals with “X”s indicate sequences without that respective MARE sequence. (F) Effect of Maf on the Bglap1-luc variants. (G) Recruitment of Maf to the Bglap1 promoter region containing MARE1–MARE3. Calvarial cells cultured with osteogenic medium for 7 days were analyzed by ChIP. (H) Effect of Runx2 and AP-1 family members on Maf-mediated activation of 1050Oc-luc. *P < 0.05; **P < 0.01.
Figure 3
Figure 3. Physical interaction of Maf with Runx2.
Maf and MafΔN, but not MafΔC, bound to Runx2. Runx2 and Runx2ΔC, but not Runx2ΔN, bound to Maf. Maf contains a transactivated domain (acidic domain), a histidine cluster (His rich), glycine stretches (Gly rich), and a basic leucine zipper domain (bZip domain). The asterisk indicates nonspecific bands.
Figure 4
Figure 4. Maf inhibition of adipocyte differentiation by suppressing Cebpδ/α-mediated induction of Pparg.
(A) mRNA expression of adipocyte-specific genes in WT and Maf–/– calvarial cells cultured with osteogenic medium (GeneChip analysis). (B) Adipocyte formation in WT and Maf–/– calvarial cells cultured with osteogenic medium (oil red O staining). (C) Expression of Pparg and Fabp4 in WT and Maf–/– calvarial cells cultured with osteogenic medium (real-time RT-PCR analysis). (D) Effect of Maf overexpression on adipocyte and osteoblast differentiation of C3H10T1/2 cells. Scale bar: 200 μm. (E) Effect of Crebbp overexpression on Maf-mediated inhibition of Cebpδ activation of the Pparg promoter. (F) Inhibition of interaction between Cebpδ and Crebbp by Maf. *P < 0.05; **P < 0.01.
Figure 5
Figure 5. Increased adipogenesis in the Maf deficiency.
(A) Expression of Pparg in the tibia of WT and Maf–/– littermates (in situ hybridization). Scale bar: 100 μm. (B) Histological analysis of the bone marrow of 22-week-old WT and Maf+/– female mice (femur, toluidine blue staining). Yellow boxed regions in the top panels are shown at higher magnification in the bottom panels. Note that Maf+/– bone marrow is filled with adipocytes. The number, but not the size, of adipocytes was significantly increased (n = 6). Scale bar: 500 μm (top row); 50 μm (bottom row). (C) Three-dimensional microcomputed tomography images of the femurs of 22-week-old WT and Maf+/– mice. Scale bar: 200 μm. (D) Parameters of osteoblastic bone formation in the bone morphometric analysis (n = 6; 22–26 weeks old). *P < 0.05; **P < 0.01.
Figure 6
Figure 6. Aging and Maf-mediated regulation of osteoblastogenesis and adipogenesis.
(A) Effect of Maf overexpression in mesenchymal cells on an aging phenotype of Maf+/– mice. Three-dimensional microcomputed tomography images and histological analysis of the bone marrow (toluidine blue staining) of Maf+/– mice transplanted with Maf-transduced or mock-infected calvarial cells. Scale bar: 200 μm (top row); 100 μm (bottom row). (B) Effect of hydrogen peroxide on Maf expression in WT and Trp53–/– calvarial osteoblasts (real-time RT-PCR analysis). (C) Effect of N-acetylcys­teine (NAC) administration on an aging phenotype of Maf+/– mice. Three-dimensional microcomputed tomography images (top row) and histology of the bone marrow (toluidine blue staining, middle and bottom rows) of mice (n = 4). Images in the middle row are shown at higher magnification in the bottom row. Scale bar: 500 μm (top and middle rows); 50 μm (bottom row). (D) Microcomputed tomography and histological analysis of WT and Maf+/– mice. (E) A model of Maf-mediated reciprocal regulation of osteoblast and adipocyte differentiation. *P < 0.05; **P < 0.01.

Comment in

  • c-Maf and you won't see fat.
    McCauley LK. McCauley LK. J Clin Invest. 2010 Oct;120(10):3440-2. doi: 10.1172/JCI44786. Epub 2010 Sep 27. J Clin Invest. 2010. PMID: 20877008 Free PMC article.

References

    1. Collado M, Blasco MA, Serrano M. Cellular senescence in cancer and aging. Cell. 2007;130(2):223–233. doi: 10.1016/j.cell.2007.07.003. - DOI - PubMed
    1. Chen JH, Hales CN, Ozanne SE. DNA damage, cellular senescence and organismal ageing: causal or correlative? Nucleic Acids Res. 2007;35(22):7417–7428. doi: 10.1093/nar/gkm681. - DOI - PMC - PubMed
    1. Uccelli A, Moretta L, Pistonia V. Mesenchymal stem cells in health and disease. Nat Rev Immunol. 2008;8(9):726–736. doi: 10.1038/nri2395. - DOI - PubMed
    1. Engler AJ, Sen S, Sweeney HL, Discher DE. Matrix elasticity directs stem cell lineage specification. Cell. 2006;126(4):677–689. doi: 10.1016/j.cell.2006.06.044. - DOI - PubMed
    1. Meunier P, Aaron J, Edouard C, Vignon G. Osteoporosis and the replacement of cell populations of the marrow by adipose tissue. A quantitative study of 84 iliac bone biopsies. Clin Orthop Relat Res. 1971;80:147–154. - PubMed

Publication types