. 2011 Feb;19(2):224-30.
doi: 10.1038/ejhg.2010.162. Epub 2010 Sep 29.

The Y-chromosome landscape of the Philippines: extensive heterogeneity and varying genetic affinities of Negrito and non-Negrito groups

Affiliations

The Y-chromosome landscape of the Philippines: extensive heterogeneity and varying genetic affinities of Negrito and non-Negrito groups

Frederick Delfin et al. Eur J Hum Genet. 2011 Feb.

Abstract

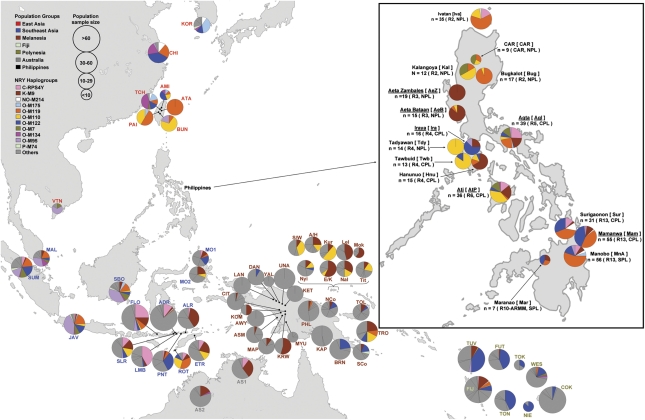
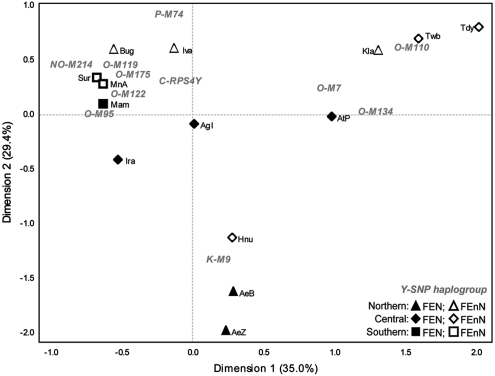
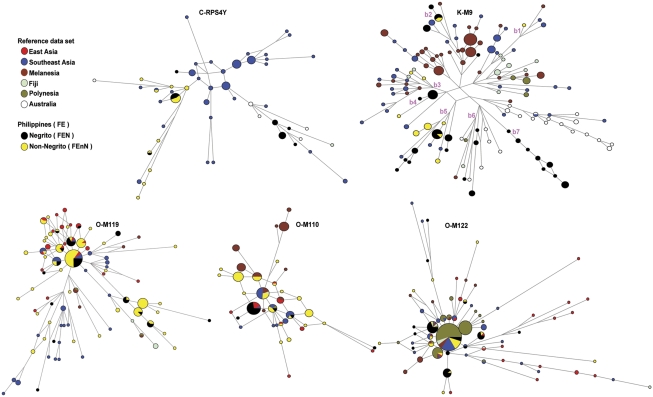
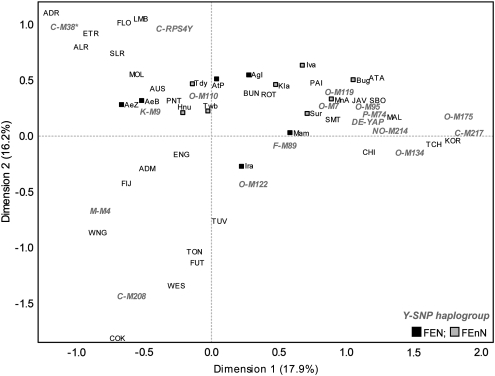
The Philippines exhibits a rich diversity of people, languages, and culture, including so-called 'Negrito' groups that have for long fascinated anthropologists, yet little is known about their genetic diversity. We report here, a survey of Y-chromosome variation in 390 individuals from 16 Filipino ethnolinguistic groups, including six Negrito groups, from across the archipelago. We find extreme diversity in the Y-chromosome lineages of Filipino groups with heterogeneity seen in both Negrito and non-Negrito groups, which does not support a simple dichotomy of Filipino groups as Negrito vs non-Negrito. Filipino non-recombining region of the human Y chromosome lineages reflect a chronology that extends from after the initial colonization of the Asia-Pacific region, to the time frame of the Austronesian expansion. Filipino groups appear to have diverse genetic affinities with different populations in the Asia-Pacific region. In particular, some Negrito groups are associated with indigenous Australians, with a potential time for the association ranging from the initial colonization of the region to more recent (after colonization) times. Overall, our results indicate extensive heterogeneity contributing to a complex genetic history for Filipino groups, with varying roles for migrations from outside the Philippines, genetic drift, and admixture among neighboring groups.


Figures

Figure 1
Figure 1
Distribution of Y-SNP haplogroups observed among Filipino groups and the reference data set. The figure shows the frequency and geographical distribution across the Asia-Pacific region of the 11 Y-SNP haplogroups observed among Filipino groups. Pie chart size represents population sample size. Colors distinguish haplogroups within pie charts, with pie chart sections representing haplogroup frequencies. Population groups (East Asian, Southeast Asia, Melanesian, Fiji, Polynesia, Australia, and the Philippines) each have a common color for their three-letter population codes. For the Philippines, labels include language group name, [population code], population sample size ‘n'. Labels in parenthesis indicate geographical region (R#, CAR – Cordillera Administrative Region, ARMM – Autonomous Region of Muslim Mindanao) and language classification: northern Philippine language (NPL), central Philippine language (CPL) or southern Philippine language (SPL) based on the Ethnologue. Underlined Filipino group names and codes indicate Negrito groups. Population codes for the reference data set are enumerated in Supplementary Text.
Figure 2
Figure 2
CA plot based on Y-SNP haplogroup frequencies of Filipino groups. Percentages in parentheses indicate the fraction of the variance explained by each dimension. Haplogroups are in gray text, while population codes are in black text. Population codes are the same as in Figure 1. All groups with sample sizes <10 (Figure 1) were excluded from the analyses.
Figure 3
Figure 3
Networks for Y-SNP haplogroups C-RPS4Y, K-M9, O-M119, O-M110, and O-M122. Networks are based on seven haplogroup-associated Y-STR loci for Filipino groups and the reference data set. Circles represent Y-STR haplotypes, with the area of the circle proportional to the frequency of the haplotype. A circle with more than one color indicates a haplotype that is shared between different populations. Nodes without circles that connect branches are median vectors that represent inferred ancestral haplotypes. Branch lengths are proportional to the number of mutational steps. Marked K-M9 network branches (b1–b7) highlight the different associations of FE groups in the K-M9 network. For all networks, specific FE groups are stated in the main paper text.
Figure 4
Figure 4
CA plot based on haplogroup frequencies of Filipino groups and the reference data set. Percentages under each dimension label indicate the fraction of the variance explained by each dimension. All groups with sample sizes <10 (Figure 1, Supplementary Text) were excluded from the analyses. Haplogroups are in gray text, while population codes are in black text. Population codes are the same as in Figure 1 and enumerated in Supplementary Text.

References

    1. O'Connell JF, Allen J. Dating the colonization of Sahul (Pleistocene Australia–New Guinea): a review of recent research. J Arch Sci. 2004;31:835–853.
    1. Détroit F, Dizon E, Falguères C, Hameau S, Ronquillo W, Sémah F. Upper Pleistocene Homo sapiens from the Tabon cave (Palawan, The Philippines): description and dating of new discoveries. C R Palevol. 2004;3:705–712.
    1. Barker G, Barton H, Bird M, et al. The ‘human revolution' in lowland tropical Southeast Asia: the antiquity and behavior of anatomically modern humans at Niah Cave (Sarawak, Borneo) J Hum Evol. 2007;52:243–261. - PubMed
    1. Gray RD, Drummond AJ, Greenhill SJ. Language Phylogenies Reveal Expansion Pulses and Pauses in Pacific Settlement. Science. 2009;323:479–483. - PubMed
    1. Gordon RG, Jr. (ed).: Ethnologue: Languages of the World15th edn.Dallas, Tex: SIL International; Online version: http://www.ethnologue.com/ , 2005