

Topographic electrophysiological signatures of FMRI Resting State Networks
- PMID: 20877577
- PMCID: PMC2943931
- DOI: 10.1371/journal.pone.0012945
Topographic electrophysiological signatures of FMRI Resting State Networks
Abstract
Background: fMRI Resting State Networks (RSNs) have gained importance in the present fMRI literature. Although their functional role is unquestioned and their physiological origin is nowadays widely accepted, little is known about their relationship to neuronal activity. The combined recording of EEG and fMRI allows the temporal correlation between fluctuations of the RSNs and the dynamics of EEG spectral amplitudes. So far, only relationships between several EEG frequency bands and some RSNs could be demonstrated, but no study accounted for the spatial distribution of frequency domain EEG.
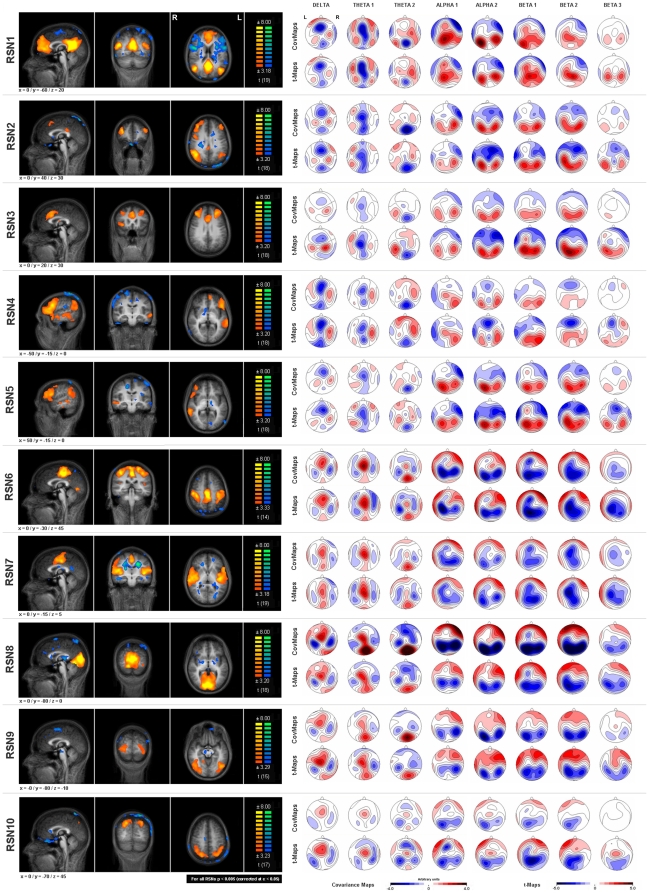
Methodology/principal findings: In the present study we report on the topographic association of EEG spectral fluctuations and RSN dynamics using EEG covariance mapping. All RSNs displayed significant covariance maps across a broad EEG frequency range. Cluster analysis of the found covariance maps revealed the common standard EEG frequency bands. We found significant differences between covariance maps of the different RSNs and these differences depended on the frequency band.
Conclusions/significance: Our data supports the physiological and neuronal origin of the RSNs and substantiates the assumption that the standard EEG frequency bands and their topographies can be seen as electrophysiological signatures of underlying distributed neuronal networks.
Conflict of interest statement
Figures
Similar articles
-
Spatiotemporal dynamics of the brain at rest--exploring EEG microstates as electrophysiological signatures of BOLD resting state networks.Neuroimage. 2012 May 1;60(4):2062-72. doi: 10.1016/j.neuroimage.2012.02.031. Epub 2012 Feb 22. Neuroimage. 2012. PMID: 22381593
-
Shifted coupling of EEG driving frequencies and fMRI resting state networks in schizophrenia spectrum disorders.PLoS One. 2013 Oct 4;8(10):e76604. doi: 10.1371/journal.pone.0076604. eCollection 2013. PLoS One. 2013. PMID: 24124576 Free PMC article.
-
Reconstructing Large-Scale Brain Resting-State Networks from High-Resolution EEG: Spatial and Temporal Comparisons with fMRI.Brain Connect. 2016 Mar;6(2):122-35. doi: 10.1089/brain.2014.0336. Epub 2015 Oct 13. Brain Connect. 2016. PMID: 26414793
-
Optimizing EEG Source Reconstruction with Concurrent fMRI-Derived Spatial Priors.Brain Topogr. 2022 May;35(3):282-301. doi: 10.1007/s10548-022-00891-3. Epub 2022 Feb 10. Brain Topogr. 2022. PMID: 35142957 Free PMC article.
-
Mapping cognitive and emotional networks in neurosurgical patients using resting-state functional magnetic resonance imaging.Neurosurg Focus. 2020 Feb 1;48(2):E9. doi: 10.3171/2019.11.FOCUS19773. Neurosurg Focus. 2020. PMID: 32006946 Free PMC article. Review.
Cited by
-
EEG correlates of self-referential processing.Front Hum Neurosci. 2013 Jun 6;7:264. doi: 10.3389/fnhum.2013.00264. eCollection 2013. Front Hum Neurosci. 2013. PMID: 23761757 Free PMC article.
-
Widespread grey matter changes and hemodynamic correlates to interictal epileptiform discharges in pharmacoresistant mesial temporal epilepsy.J Neurol. 2013 Jun;260(6):1601-10. doi: 10.1007/s00415-013-6841-2. Epub 2013 Jan 26. J Neurol. 2013. PMID: 23355177
-
Cerebral blood flow imbalance is associated with motor outcome after pediatric arterial ischemic stroke.PLoS One. 2019 Oct 11;14(10):e0223584. doi: 10.1371/journal.pone.0223584. eCollection 2019. PLoS One. 2019. PMID: 31603919 Free PMC article.
-
Motor learning- and consolidation-related resting state fast and slow brain dynamics across wake and sleep.Sci Rep. 2024 Mar 29;14(1):7531. doi: 10.1038/s41598-024-58123-6. Sci Rep. 2024. PMID: 38553500 Free PMC article.
-
Early Changes in Alpha Band Power and DMN BOLD Activity in Alzheimer's Disease: A Simultaneous Resting State EEG-fMRI Study.Front Aging Neurosci. 2017 Oct 6;9:319. doi: 10.3389/fnagi.2017.00319. eCollection 2017. Front Aging Neurosci. 2017. PMID: 29056904 Free PMC article.
References
-
- Gibbs FA, Knott JR. Growth of the electrical activity of the cortex. Electroencephalogr Clin Neurophysiol. 1949;1:223–229. - PubMed
-
- John ER, Ahn H, Prichep L, Trepetin M, Brown D, et al. Developmental equations for the electroencephalogram. Science. 1980;210:1255–1258. - PubMed
-
- John ER, Prichep LS, Fridman J, Easton P. Neurometrics: computer-assisted differential diagnosis of brain dysfunctions. Science. 1988;239:162–169. - PubMed
-
- John ER. A field theory of consciousness. Conscious Cogn. 2001;10:184–213. - PubMed
-
- Tinguely G, Finelli LA, Landolt HP, Borbely AA, Achermann P. Functional EEG topography in sleep and waking: state-dependent and state-independent features. Neuroimage. 2006;32:283–292. - PubMed
