Comparative Study
. 2010 Sep 21;5(9):e12839.
doi: 10.1371/journal.pone.0012839.

Elusive copy number variation in the mouse genome

Affiliations
Comparative Study

Elusive copy number variation in the mouse genome

Avigail Agam et al. PLoS One. .

Abstract

Background: Array comparative genomic hybridization (aCGH) to detect copy number variants (CNVs) in mammalian genomes has led to a growing awareness of the potential importance of this category of sequence variation as a cause of phenotypic variation. Yet there are large discrepancies between studies, so that the extent of the genome affected by CNVs is unknown. We combined molecular and aCGH analyses of CNVs in inbred mouse strains to investigate this question.

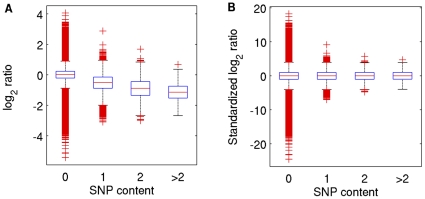
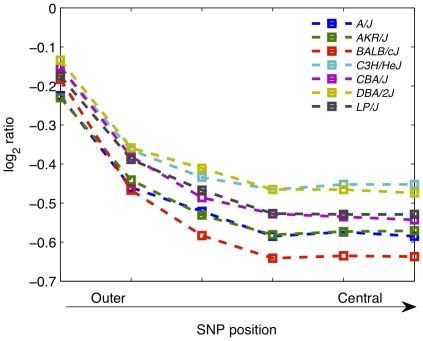
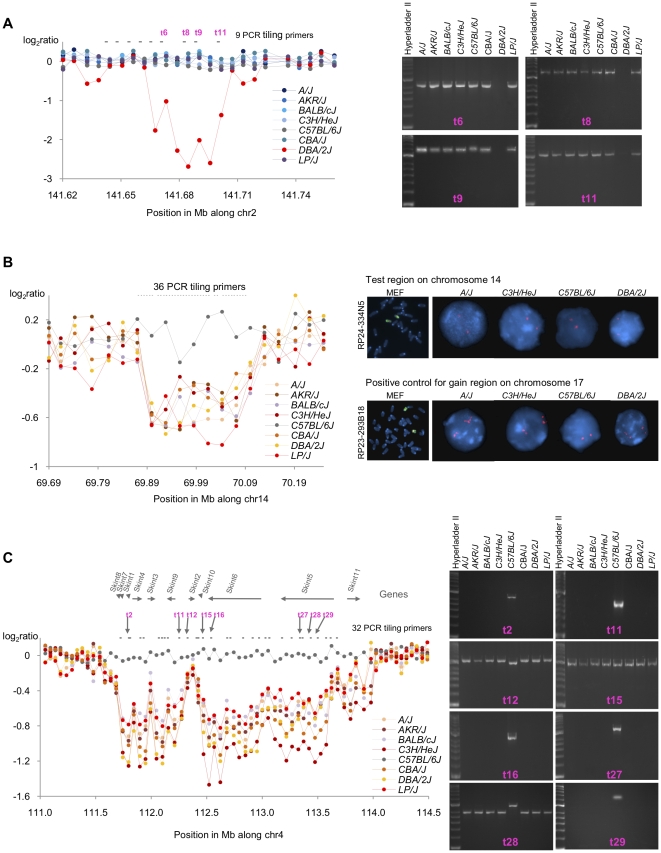
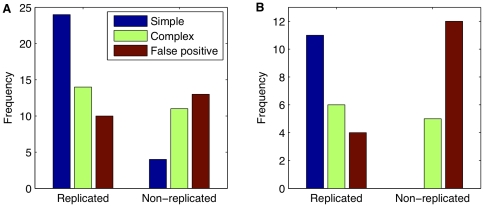
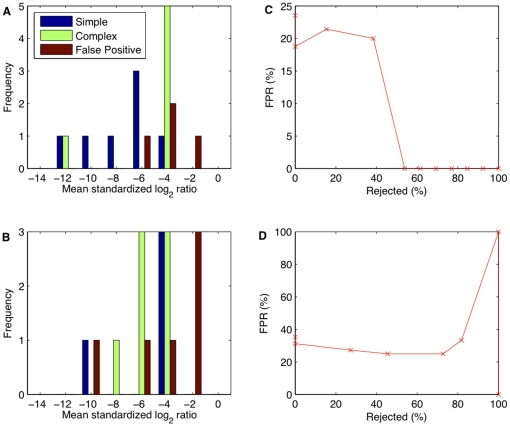
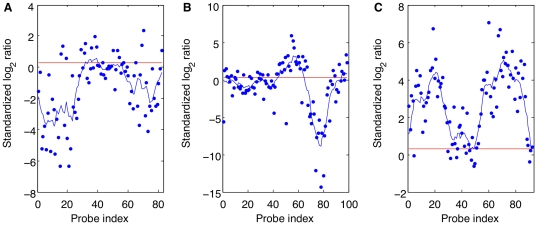
Principal findings: Using a 2.1 million probe array we identified 1,477 deletions and 499 gains in 7 inbred mouse strains. Molecular characterization indicated that approximately one third of the CNVs detected by the array were false positives and we estimate the false negative rate to be more than 50%. We show that low concordance between studies is largely due to the molecular nature of CNVs, many of which consist of a series of smaller deletions and gains interspersed by regions where the DNA copy number is normal.

Conclusions: Our results indicate that CNVs detected by arrays may be the coincidental co-localization of smaller CNVs, whose presence is more likely to perturb an aCGH hybridization profile than the effect of an isolated, small, copy number alteration. Our findings help explain the hitherto unexplored discrepancies between array-based studies of copy number variation in the mouse genome.


Conflict of interest statement

Competing Interests: The authors have declared that no competing interests exist.

Figures

Figure 1
Figure 1. Distribution of log2 ratios from probes with and without SNPs, before and after standardization.
A: Box and whisker plots of log2 ratios from probes with zero, one, two and more than two SNPs in their sequence in the A/J versus C57BL/6J experiment (normal dye); the boxes represent the inter-quartile ranges of the distributions, the whiskers are 1.5 times the inter-quartile range, and red crosses are outliers. The median log2 ratios from probes with zero, one, two and three or more SNPs are 0.02, −0.50, −0.88 and −1.14, respectively. B: Box and whisker plots of the standardized log2 ratios from probes with zero, one, two and more than two SNPs.
Figure 2
Figure 2. SNP effect depends on position within probe.
Log2 ratios of probes containing one SNP were classified by the position of the SNP within the probe (probes were divided into 11 segments of equal length, and symmetrical segments combined to form one category; so log2 ratios from probes with SNPs in either of the outermost segments were grouped together, and so on). Shown here are the median log2 ratios from each category, in each strain.
Figure 3
Figure 3. Example of a simple, false positive and complex CNV region.
Here we show an example for each class of deletion-CNV region: A) simple, B) false positive and C) complex. Graphics on the left hand side show the distribution of CGH signal intensities in eight inbred strains of mice: A/J, AKR/J, BALB/cJ, C3H/HeJ, C57BL/6J, CBA/J, DBA/2J and LP/J. The X-axis is the position in Mb and the Y-axis is the log2 ratio (averaged in windows of 5 probes for A and B and 40 for C). Images on the right hand side constitute a representative set of independent validation experiments. A: 39 Kb simple deletion identified in DBA/2J on Chr 2: 141.669 Mb–141.708 Mb. Tiling PCR primers are displayed at the top of the graph. In total, we designed 9 tiling primers (t1 to t11), each amplifying regions of ∼1.2 Kb across the region and its 5′ flanking region. We highlight a representative set in pink (primers t6, t8, t9 and t11) for which PCR results are shown on the right of the graphic. See Table S12 for details of all primers and PCR results. This deletion lies within intron 8 of the gene Macrod2 . B: 220 Kb false positive deletion identified in all the test strains, on Chr14: 69.87 Mb–70.09 Mb, in our 385K aCGH study. We designed 36 tiling primers spanning the region (represented at the top of the graphic). PCR results showed amplification in all 8 strains (Table S12) suggesting a false positive deletion. We also carried out FISH experiments. We used two BACs, RP24-334N5 (Chr 14: 69.9 Mb–70.07 Mb) for the test region on chromosome 14 and RP23-293B18 (Chr 17: 30.83 Mb–31.0 Mb) as a positive gain control on mouse chromosome 17. FISH data show that the region is not deleted. C: 2.44 Mb fragmented deletion identified in all the test strains on Chr 4: 111.58 Mb–114.02 Mb. PCR results are shown for 8 representative tiling primers out of a total of 32 (highlighted in pink). There is no amplification in the test strains from t2 to t11, t16 to t27 and t29, thus validating the deletion. However, primers t1, t12 to t15 and t28 have amplified in all strains. Genes are represented at the top using grey arrows. The first deletion affects Skint4, Skint3 and Skint9 , and the second deletion affects Skint6 and Skint5; the latter finding has not been reported previously.
Figure 4
Figure 4. Concordance between studies for simple, complex and false positive CNVs.
A: Deletion-CNV regions detected in our experiments were determined, by molecular validation, to be either simple (blue), complex (green) or false positive (red); their constituent CNVs were classified accordingly. Examining only the CNVs detected in the four strains which were common to both our study and the Cahan et al. study (A/J, AKR/J, C3H/HeJ, DBA/2J), we established, for each category, the frequency of our deletions replicated and not replicated; a CNV was counted as replicated if it had at least partial overlap with a CNV on the same strain in that study. B: Similarly for gains.
Figure 5
Figure 5. Distribution of mean standardized log2 ratios in simple, complex and false positive deletions.
A: Distribution of the mean standardized log2 ratios in simple (blue), complex (green) and false positive (red) A/J deletions that were included in the molecular validation experiments described in the main text. B: Similarly for BALB/cJ. C: We examined all thresholds for accepting a deletion between −1 and −14. For each threshold we plot the false positive rate (FPR), calculated as the percentage of all accepted deletions that are false positives, against the percentage of all verified deletions that are rejected (where verified deletions are defined as those which were categorized as either simple or complex in the molecular validation experiments). Results are shown for A/J. D: Results are shown for BALB/cJ. (See Figure S2 for the remaining test strains).
Figure 6
Figure 6. Complex CNV architecture elucidated by targeted high-density aCGH.
Three CNVs in C3H/HeJ, inspected using the targeted array; the red line is the median log2 ratio observed in control regions, blue dots are the SNP standardized log2 ratios for each probe in the region, and the blue line is the smoothed signal (using a window size of 10% of the number of probes). A: Putative deletion on Chr 1: 95.74 Mb–95.89 Mb is composed of two smaller deletions, separated by a region of normal copy number. B: Putative deletion on Chr 16: 49.34 Mb–49.37 Mb harbors a small gain. C: Putative gain on Chr 18: 31.78 Mb–31.80 Mb is composed of two smaller gains separated by a region of normal copy number.

References

    1. Conrad DF, Pinto D, Redon R, Feuk L, Gokcumen O, et al. Nature; 2009. Origins and functional impact of copy number variation in the human genome. - PMC - PubMed
    1. Redon R, Ishikawa S, Fitch KR, Feuk L, Perry GH, et al. Global variation in copy number in the human genome. Nature. 2006;444:444–454. - PMC - PubMed
    1. Stranger BE, Forrest MS, Dunning M, Ingle CE, Beazley C, et al. Relative impact of nucleotide and copy number variation on gene expression phenotypes. Science. 2007;315:848–853. - PMC - PubMed
    1. Orozco LD, Cokus SJ, Ghazalpour A, Ingram-Drake L, Wang S, et al. Copy number variation influences gene expression and metabolic traits in mice. Hum Mol Genet. 2009;18:4118–4129. - PMC - PubMed
    1. Henrichsen CN, Vinckenbosch N, Zollner S, Chaignat E, Pradervand S, et al. Segmental copy number variation shapes tissue transcriptomes. Nat Genet. 2009;41:424–429. - PubMed

Publication types