

Better antiretroviral therapy outcomes at primary healthcare facilities: an evaluation of three tiers of ART services in four South African provinces
- PMID: 20877631
- PMCID: PMC2943483
- DOI: 10.1371/journal.pone.0012888
Better antiretroviral therapy outcomes at primary healthcare facilities: an evaluation of three tiers of ART services in four South African provinces
Abstract
Background: There are conflicting reports of antiretroviral therapy (ART) effectiveness comparisons between primary healthcare (PHC) facilities and hospitals in low-income settings. This comparison has not been evaluated on a broad scale in South Africa.
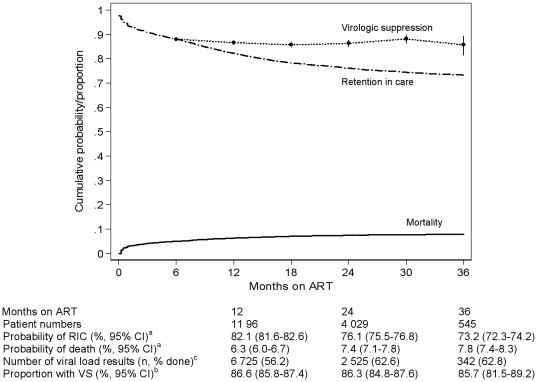
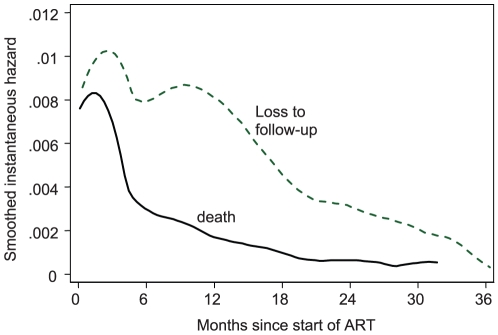
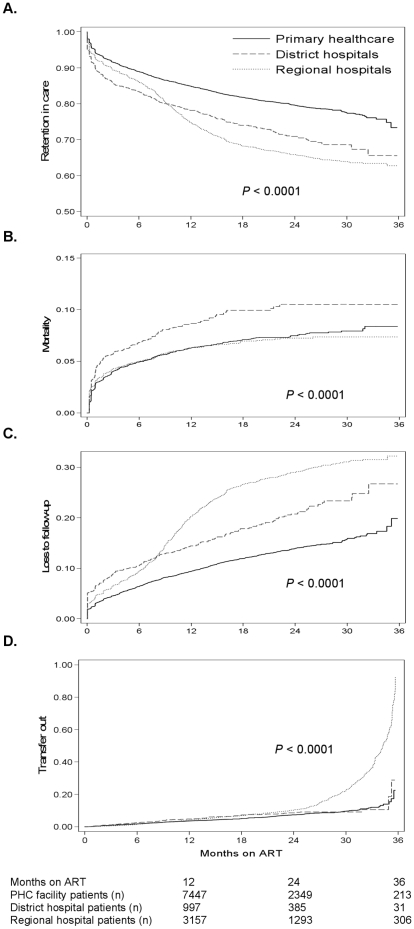
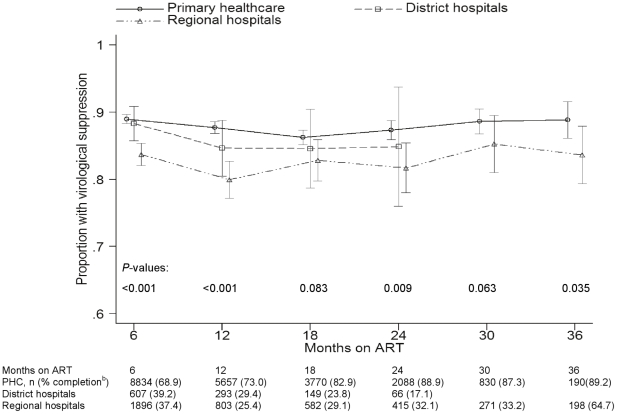
Methodology/principal findings: A retrospective cohort study was conducted including ART-naïve adults from 59 facilities in four provinces in South Africa, enrolled between 2004 and 2007. Kaplan-Meier estimates, competing-risks Cox regression, generalised estimating equation population-averaged models and logistic regression were used to compare death, loss to follow-up (LTFU) and virological suppression (VS) between PHC, district and regional hospitals. 29 203 adults from 47 PHC facilities, nine district hospitals and three regional hospitals were included. Patients at PHC facilities had more advanced WHO stage disease when starting ART. Retention in care was 80.1% (95% CI: 79.3%-80.8%), 71.5% (95% CI: 69.1%-73.8%) and 68.7% (95% CI: 67.0%-69.7%) at PHC, district and regional hospitals respectively, after 24 months of treatment (P<0.0001). In adjusted regression analyses, LTFU was independently increased at regional hospitals (aHR 2.19; 95% CI: 1.94-2.47) and mortality was independently elevated at district hospitals (aHR 1.60; 95% CI: 1.30-1.99) compared to PHC facilities after 12 months of ART. District and regional hospital patients had independently reduced probabilities of VS, aOR 0.76 (95% CI: 0.59-0.97) and 0.64 (95% CI: 0.56-0.75) respectively compared to PHC facilities over 24 months of treatment.
Conclusions/significance: ART outcomes were superior at PHC facilities, despite PHC patients having more advanced clinical stage disease when starting ART, suggesting that ART can be adequately provided at this level and supporting the South African government's call for rapid up-scaling of ART at the primary level of care. Further prospective research is required to determine the degree to which outcome differences are attributable to either facility level characteristics or patient co-morbidity at hospital level.
Conflict of interest statement
Figures
References
-
- UNAIDS/WHO Epidemiological Fact Sheets on HIV and AIDS, South Africa 2008 Update. Available: http://apps.who.int/globalatlas/predefinedReports/EFS2008/full/EFS2008_Z... Accessed 26 November 2009.
-
- UNAIDS/WHO AIDS epidemic update: November 2009. Available: http://www.unaids.org/en/KnowledgeCentre/HIVData/EpiUpdate/EpiUpdArchive... Accessed 26 November 2009.
-
- Adam MA, Johnson LF. Estimation of adult antiretroviral treatment coverage in South Africa. South African Medical Journal. 2009;99:661–667. - PubMed
-
- South African Department of Health. 2007. HIV and AIDS and STI strategic plan for South Africa, 2007-2011. Available: http://www.doh.gov.za/docs/misc/stratplan-f.html Accessed 11 November 2009.
-
- Actuarial Society of South Africa. 2005. ASSA2003 AIDS and Demographic model. Available: http://assaaids.eu1.rentasite.co.za/ASSA2003-Model-3165.htm Accessed 11 November 2009.
MeSH terms
Substances
LinkOut - more resources
Full Text Sources
Medical
Miscellaneous
