. 2010 Aug;37(8):3957-69.
doi: 10.1118/1.3429056.

An analytical model of the effects of pulse pileup on the energy spectrum recorded by energy resolved photon counting x-ray detectors

Affiliations

An analytical model of the effects of pulse pileup on the energy spectrum recorded by energy resolved photon counting x-ray detectors

Katsuyuki Taguchi et al. Med Phys. 2010 Aug.

Abstract

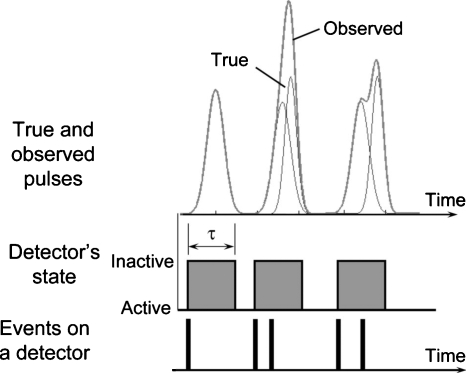
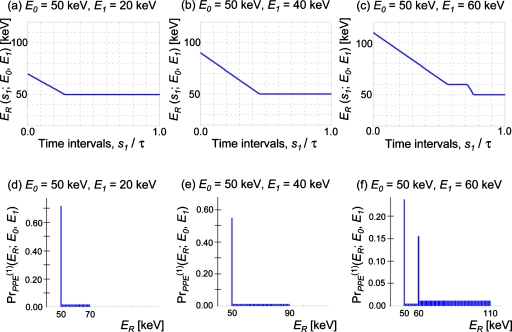
Purpose: Recently, novel CdTe photon counting x-ray detectors (PCXDs) with energy discrimination capabilities have been developed. When such detectors are operated under a high x-ray flux, however, coincident pulses distort the recorded energy spectrum. These distortions are called pulse pileup effects. It is essential to compensate for these effects on the recorded energy spectrum in order to take full advantage of spectral information PCXDs provide. Such compensation can be achieved by incorporating a pileup model into the image reconstruction process for computed tomography, that is, as a part of the forward imaging process, and iteratively estimating either the imaged object or the line integrals using, e.g., a maximum likelihood approach. The aim of this study was to develop a new analytical pulse pileup model for both peak and tail pileup effects for nonparalyzable detectors.

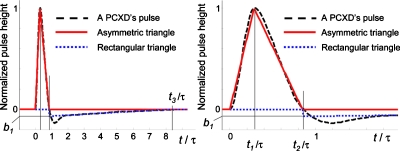
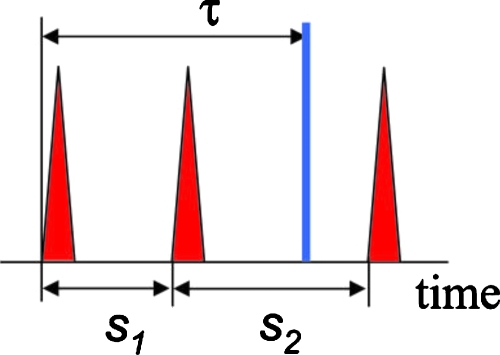
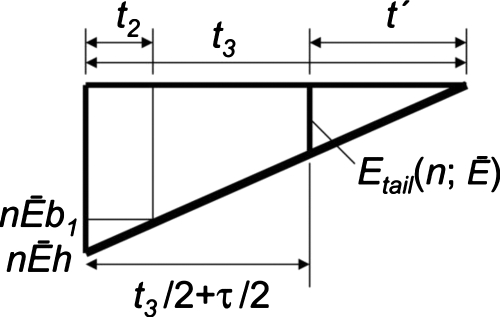
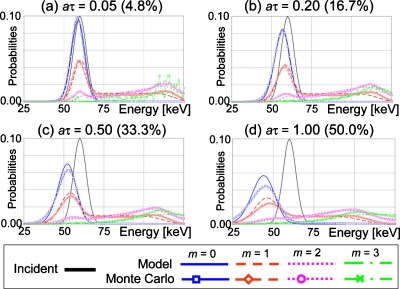
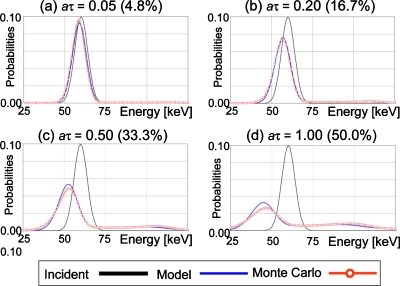
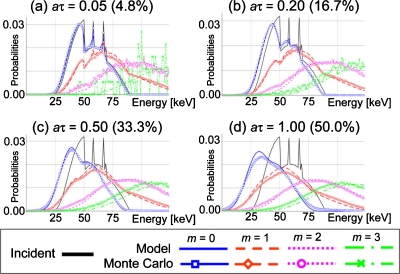
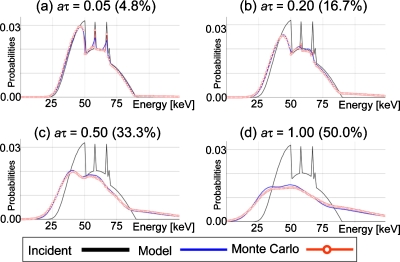
Methods: The model takes into account the following factors: The bipolar shape of the pulse, the distribution function of time intervals between random events, and the input probability density function of photon energies. The authors used Monte Carlo simulations to evaluate the model.

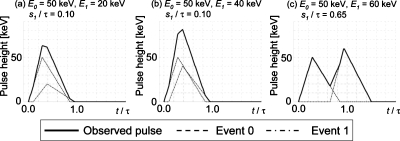
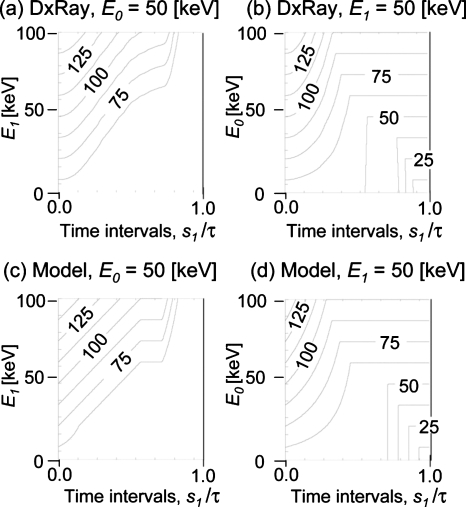
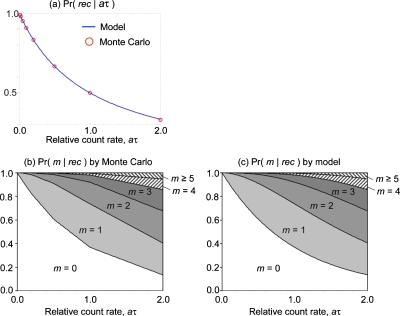
Results: The recorded spectra estimated by the model were in an excellent agreement with those obtained by Monte Carlo simulations for various levels of pulse pileup effects. The coefficients of variation (i.e., the root mean square difference divided by the mean of measurements) were 5.3%-10.0% for deadtime losses of 1%-50% with a polychromatic incident x-ray spectrum.

Conclusions: The proposed pulse pileup model can predict recorded spectrum with relatively good accuracy.


Figures

Figure 1
Figure 1
The count rate loss and pulse pileup effects due to quasicoincident photons with nonparalyzable photon counting detectors. When photon counting detectors are in active state, the first photon incident on the detector will put the detector into the detection (inactive) state for a finite period of time called the deadtime (or resolving time) τ. The height of the observed pulse during the deadtime is associated with the photon energy and a count is added to the corresponding energy window. All photons incident on the detector during this state will contribute to form the observed pulse of one count, resulting in lost counts and distorted recorded energy spectrum.
Figure 2
Figure 2
A bipolar-shaped pulse (dashed black curve) obtained by a PCXD is approximated by two triangles. An asymmetric triangle defined by t1 and t2 approximates the positive part of the pulse for peak pileup effect, while a right angle (rectangular) triangle defined by t2, t3, and b1 fits the negative part for tail pileup effect. Two plots are shown in different ranges.
Figure 3
Figure 3
Time intervals s1 and s2 and detector deadtime τ.
Figure 4
Figure 4
Pictorial descriptions of an observed pulse with given energies and a time interval between two events. The recorded energy ER(s1;E0,E1) is the maximum energy between t=0 and τ. (a) E0=50 keV, E1=20 keV, and s1∕τ=0.10; (b) E0=50 keV, E1=40 keV, and s1∕τ=0.10; and (c) E0=50 keV, E1=60 keV, and s1∕τ=0.65.
Figure 5
Figure 5
[(a)–(c)] The recorded energies ER(s1;E0,E1) given various time intervals s1 and the incident energies E0 and E1. [(d)–(f)] The PDFs of the recorded energies ER given the incident energies E0 and E1 for pileup order 1.
Figure 6
Figure 6
Tail pileup effect: The bias Etail(n;E¯) (<0) is added to the measured energy of the subsequent events-of-interest.
Figure 7
Figure 7
Contour maps of the recorded energy with first order pulse pileup (m=1) under various conditions when the observed pulse height is 0 at t=0.
Figure 8
Figure 8
(a) A plot of the probability of events being counted Pr(rec|aτ), obtained by the model and by Monte Carlo simulations. [(b) and (c)] Area plots of the probabilities of mth order pileup given the events-of-interest being counted Pr(m|rec), obtained by (b) Monte Carlo simulations and by (c) the model.
Figure 9
Figure 9
The PDF of the recorded spectra for mth order pileup Pr(E|m), with the quasimonochromatic 60 keV input x-ray spectrum at various relative count rates aτ, obtained using the model and Monte Carlo simulations. Numbers in parentheses are count rate loss ratios, 1−Pr(rec|aτ) (%). Oscillations in Monte Carlo results (e.g., m=3 with aτ=0.05) was due to a limited number of cases (counts).
Figure 10
Figure 10
The PDF of the total recorded spectra Pr(E), the quasimonochromatic 60 keV input x-ray spectrum at various relative count rates aτ, obtained by the model and Monte Carlo simulations. Numbers in parentheses are count rate loss ratio 1−Pr(rec|aτ) (%).
Figure 11
Figure 11
The PDFs of the recorded spectrum for mth order pileup Pr(E|m), with 90 kVp polychromatic input x-ray spectrum at various relative count rates aτ, obtained using the model and Monte Carlo simulations. Numbers in parentheses are count rate loss ratio 1−Pr(rec|aτ) (%). Oscillations in Monte Carlo results (e.g., m=3 with aτ=0.05) were due to a limited number of cases (counts).
Figure 12
Figure 12
The PDFs of the final recorded spectra Pr(E), with 90 kVp polychromatic x-ray at various relative count rates aτ, obtained using the model and Monte Carlo simulations. Numbers in parentheses are count rate loss ratios, 1−Pr(rec|aτ) (%).

References

    1. Mettler F. J., Wiest P., Locken J., and Kelsey C., “CT scanning: Patterns of use and dose,” J. Radiol. Prot. JRPREA 20, 353–359 (2000).10.1088/0952-4746/20/4/301 - DOI - PubMed
    1. Swank R. K., “Absorption and noise in x-ray phosphors,” J. Appl. Phys. JAPIAU 44, 4199–4203 (1973).10.1063/1.1662918 - DOI
    1. Alvarez R. E. and Macovski A., “Energy-selective reconstructions in x-ray computerised tomography,” Phys. Med. Biol. PHMBA7 21, 733–744 (1976).10.1088/0031-9155/21/5/002 - DOI - PubMed
    1. Schlomka J. P., Roessl E., Dorscheid R., Dill S., Martens G., Istel T., Umer C., Herrmann C., Steadman R., Zeitler G., Livne A., and Proksa R., “Experimental feasibility of multi-energy photon-counting K-edge imaging in pre-clinical computed tomography,” Phys. Med. Biol. PHMBA7 53, 4031–4047 (2008).10.1088/0031-9155/53/15/002 - DOI - PubMed
    1. Shikhaliev P. M., “Energy-resolved computed tomography: First experimental results,” Phys. Med. Biol. PHMBA7 53, 5595–5613 (2008).10.1088/0031-9155/53/20/002 - DOI - PubMed

Publication types