

Impact of the prevention plan on employee health risk reduction
- PMID: 20879909
- PMCID: PMC3128505
- DOI: 10.1089/pop.2010.0027
Impact of the prevention plan on employee health risk reduction
Abstract
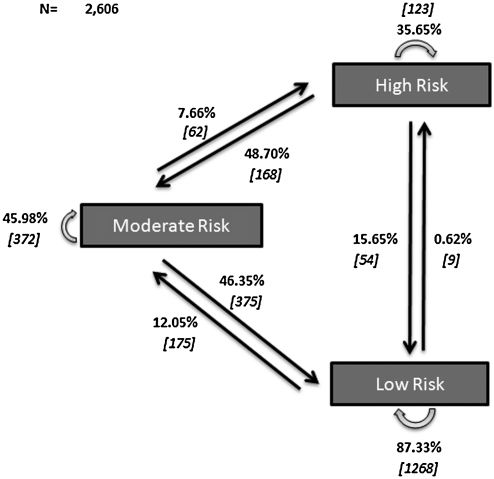
This study evaluated the impact of The Prevention Plan™ on employee health risks after 1 year of integrated primary prevention (wellness and health promotion) and secondary prevention (biometric and lab screening as well as early detection) interventions. The Prevention Plan is an innovative prevention benefit that provides members with the high-tech/high-touch support and encouragement they need to adopt healthy behaviors. Support services include 24/7 nurse hotlines, one-on-one health coaching, contests, group events, and employer incentives. Specifically, we analyzed changes in 15 health risk measures among a cohort of 2606 employees from multiple employer groups who completed a baseline health risk appraisal, blood tests, and biometric screening in 2008 and who were reassessed in 2009. We then compared the data to the Edington Natural Flow of risks. The cohort showed significant reduction in 10 of the health risks measured (9 at P≤ 0.01 and 1 at P≤0.05). The most noticeable changes in health risks were a reduction in the proportion of employees with high-risk blood pressure (42.78%), high-risk fasting blood sugar (31.13%), and high-risk stress (24.94%). There was an overall health risk transition among the cohort with net movement from higher risk levels to lower risk levels (P<0.01). There was a net increase of 9.40% of people in the low-risk category, a decrease of 3.61% in the moderate-risk category, and a 5.79% decrease in the high-risk category. Compared to Edington's Natural Flow model, 48.70% of individuals in the high-risk category moved from high risk to moderate risk (Natural Flow 31%), 46.35% moved from moderate risk to low risk (Natural Flow 35%), 15.65% moved from high risk to low risk (Natural Flow 6%), and 87.33% remained in the low-risk category (Natural Flow 70%) (P<0.001).
Figures
Comment in
-
Two-year outcomes show effectiveness of the prevention program in lowering health risks and costs.Popul Health Manag. 2011 Oct;14(5):265. doi: 10.1089/pop.2011.0057. Popul Health Manag. 2011. PMID: 21988348 No abstract available.
-
Assessing the benefit of a health prevention tool.Popul Health Manag. 2012 Jun;15(3):188. doi: 10.1089/pop.2012.0014. Popul Health Manag. 2012. PMID: 22731850 No abstract available.
References
-
- Kaiser/HRET survey of Employer-sponsored Health Benefits, 1999–2009. http://ehbs.kff.org/ [Jun 19;2010 ]. http://ehbs.kff.org/
-
- Truffer CJ. Heehan S. Smith S, et al. Health spending projections through 2019: the recession's impact continues. Health Affairs (Milwood) 2010;29:522–529. - PubMed
-
- Loeppke R. Taitel M. Haufle V. Parry T. Kessler RC. Jinnett K. Health and productivity as a business strategy: a multiemployer study. J Occup Environ Med. 2009;51:411–428. - PubMed
-
- Loeppke R. Taitel M. Richling D, et al. Health and productivity as a business strategy. J Occup Environ Med. 2007;49:712–721. - PubMed
-
- Loeppke R. Hymel PA. Lofland JH, et al. Health-related workplace productivity measurement: general and migraine-specific recommendations from the ACOEM expert panel. J Occup Environ Med. 2003;45:349–359. - PubMed
MeSH terms
LinkOut - more resources
Full Text Sources
Other Literature Sources
Miscellaneous
