

Binding of tolbutamide to glycated human serum albumin
- PMID: 20880646
- PMCID: PMC2962718
- DOI: 10.1016/j.jpba.2010.09.003
Binding of tolbutamide to glycated human serum albumin
Abstract
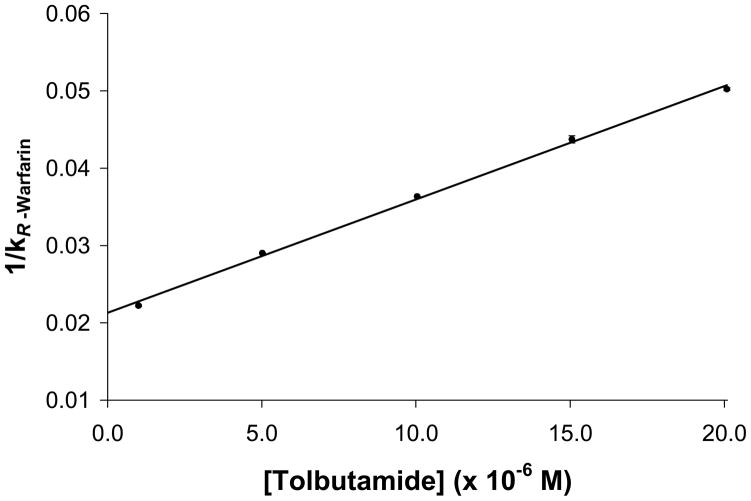
The presence of elevated levels of glucose in blood during diabetes can lead to the non-enzymatic glycation of serum proteins such as human serum albumin (HSA). This study examined the changes that occur in binding of the sulfonylurea drug tolbutamide to HSA as the level of glycation for this protein was increased. High-performance affinity chromatography was used in this work along with columns containing various preparations of in vitro glycated HSA. It was found in frontal analysis experiments that the binding of tolbutamide with all of the tested preparations of glycated HSA could be described by a two-site model involving both strong and weak affinity interactions. The association equilibrium constants (K(a)) for tolbutamide at its high affinity sites on glycated HSA were in the range of 0.8-1.2 x 10⁵ M⁻¹ and increased by 1.4-fold in going from normal HSA to mildly glycated HSA. It was found through competition studies that tolbutamide was binding at both Sudlow sites I and II on the glycated HSA, in agreement with previous studies. The K(a) for tolbutamide at Sudlow site II increased by 1.1- to 1.4-fold in going from normal HSA to glycated HSA. At Sudlow site I, the K(a) for tolbutamide increased by 1.2- to 1.3-fold in going from normal HSA to the glycated HSA samples. This information demonstrates the effects that glycation can have on drug interactions on HSA and should provide a better quantitative understanding of how the protein binding of tolbutamide in serum may be affected for individuals with diabetes.
Copyright © 2010 Elsevier B.V. All rights reserved.
Figures

References
-
- Unwin N, Whiting D, Gan D, Jacqmain O, Ghyoot G, editors. Diabetes Atlas. International Diabetes Federation; 2009.
-
- National diabetes fact sheet: General information and national estimates on diabetes in the United States. US Centers for Disease Control and Prevention; Atlanta, GA: 2007. 2008.
-
- Skillman TG, Feldman JM. The pharmacology of sulfonylureas. Am J Med. 1981;70:361–372. - PubMed
-
- Jakoby MG, Covey DF, Cistola DP. Localization of tolbutamide binding sites on human serum albumin using titration calorimetry and heteronuclear 2-D NMR. Biochem. 1995;34:8780–8787. - PubMed
-
- Koyama H, Sugioka N, Uno A, Mori S, Nakajima K. Effects of glycosylation of hypoglycaemic drug binding to serum albumin. Biopharm Drug Dispos. 1997;18:791–801. - PubMed
Publication types
MeSH terms
Substances
Grants and funding
LinkOut - more resources
Full Text Sources
Medical
