Review
. 2010 Oct 4;10 Spec no A(1A):S179-88.
doi: 10.1102/1470-7330.2010.9032.

Diffusion-weighted magnetic resonance imaging for tumour response assessment: why, when and how?

Affiliations
Review

Diffusion-weighted magnetic resonance imaging for tumour response assessment: why, when and how?

A Afaq et al. Cancer Imaging. .

Abstract

Diffusion-weighted magnetic resonance imaging (DWI) is increasingly being used to assess tumour response to a variety of anticancer treatments. The technique is quick to perform without the need for administration of exogenous contrast medium, and enables the apparent diffusion coefficient (ADC) of tissues to be quantified. Studies have shown that ADC increases in response to a variety of treatments including chemotherapy, radiotherapy, minimally invasive therapies and novel therapeutics. In this article, we review the rationale of applying DWI for tumour assessment, the evidence for ADC measurements in relation to specific treatments and some of the practical considerations for using ADC to evaluate treatment response.


Figures

Figure 1
Figure 1
Schematic diagram showing ADC changes with anticancer treatment. Graphs show frequency plots of ADC values in tumours before (solid black line) and after (dotted black line) therapy. Inserts depict a cluster of tumour cells, which demonstrate cellular lysis and apoptosis following treatment, thus increasing the mobility of water protons in that microenvironment. Note that successful therapy results in a shift of the ADC frequency plot (dotted line) towards the right as a result of increasing ADC values.
Figure 2
Figure 2
Diagram showing theoretical changes in the ADC values of tumours after commencing anticancer therapy. Plots demonstrate possible evolutions of tumour ADC (y-axis) with time (x-axis). Horizontal line and grey bars across the centre of the graph indicate the median ADC of normal tissue and the associated variability (95% confidence limits). Tumours typically return lower ADC than normal tissues. However, after commencing treatment, tumour ADC in responders rises to a peak and then gradually decreases to normal values in tissue (line 1). In some scenarios, there may be an increase in ADC that is sustained over a long period of time after treatment (line 2). In others, there may be an initial increase in ADC but a subsequent decrease that dips below the anticipated normal range (line 3). This ADC reduction may be attributed to fibrosis or inflammatory response. In addition, the ADC value may initially decrease before increasing with further therapy (line 4). In non-responders, there is often no change in the tumour ADC values. However, tumour growth or disease progression can lead to further ADC reduction (line 5).
Figure 3
Figure 3
Chart summarises published studies using ADC values to assess tumour response to chemotherapy (yellow), radiotherapy (red), chemoradiotherapy (green), hormonal therapy (purple) and targeted treatment (blue). The vertical axis shows tumour types and the horizontal axis indicates the timing of ADC measurements (in weeks) after starting treatment. Each study is displayed across from top to bottom according to tumour types and indicated on the chart (author, year). Upward arrowheads indicate an increase in ADC and downward arrowheads indicate a decrease in ADC. In studies in which multiple ADC measurements were taken, larger symbols indicate maximum ADC change. Note that many studies showed an increase in ADC values within 4 weeks of treatment. Furthermore, a number of studies showed a significant increase in ADC values within 1 week of commencing therapy.
Figure 4
Figure 4
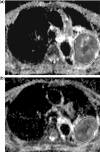
ADC maps in a man with non-small cell lung cancer (a) before and (b) after 1 month of chemotherapy. Following treatment, there was a 20% increase in the median ADC value of the tumour (pre-treatment 0.9 × 10–3 mm/s, post-treatment 1.1 × 10–3 mm/s) within the ROIs drawn (outlined) in keeping with the treatment effects. The patient was classified as a responder at 12 weeks after completing chemotherapy by conventional size criteria.
Figure 5
Figure 5
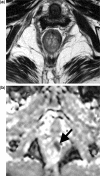
A middle-aged woman with rectal cancer who showed complete response to chemoradiotherapy. (a) On follow-up MRI, a T2-weighted MR image showed no apparent abnormality in the rectal wall. (b) An ADC map revealed a crescent of impeded diffusion with low ADC values in the left rectal wall (arrow). Biopsy confirmed disease recurrence.
Figure 6
Figure 6
ROI placement. An ROI is typically drawn just inside the outer border of a tumour on the high b value MR image and then copied onto the ADC map. This is because tumour borders are usually better delineated on the b value images compared with the ADC map.
Figure 7
Figure 7
Parametric response map. A 72-year-old man with metastatic prostate cancer. (a) Pre-treatment T1-weighted image of the pelvis showing extensive metastatic bone disease. A region of interest (in red) is drawn encompassing a metastasis in the left ilium. (b) Post-treatment T1-weighted image. Colours displayed within region of interest indicate voxels that show increase (red), decrease (blue) or no change (green) in ADC values relative to threshold determined by pre-treatment standard deviation of ADC values. (c) Scatter plot of ADC values on a voxel-by-voxel basis before and after treatment shows a large percentage of voxels showing increase in ADC values (in red) indicating treatment effects within tumour volume. (Maps generated using Oncotreat software, Siemens Medical system, Erlangen, Germany).

References

    1. Miller AB, Hoogstraten B, Staquet M, et al. Reporting results of cancer treatment. Cancer. 1981;47:207–14. doi:10.1002/1097-0142(19810101)47:1<207::AID-CNCR2820470134>3.0.CO;2-6. - DOI - PubMed
    1. Eisenhauer EA, Therasse P, Bogaerts J, et al. New response evaluation criteria in solid tumours: revised RECIST guideline (version 1.1) Eur J Cancer. 2009;45:228–47. doi:10.1016/j.ejca.2008.10.026. PMid:19097774. - DOI - PubMed
    1. Therasse P, Arbuck SG, Eisenhauer EA, et al. New guidelines to evaluate the response to treatment in solid tumors. European Organization for Research and Treatment of Cancer, National Cancer Institute of the United States, National Cancer Institute of Canada. J Natl Cancer Inst. 2000;92:205–16. doi:10.1093/jnci/92.3.205. PMid:10655437. - DOI - PubMed
    1. Harry VN, Semple SI, Parkin DE, et al. Use of new imaging techniques to predict tumour response to therapy. Lancet Oncol. 2010;11:92–102. doi:10.1016/S1470-2045(09)70190-1. - DOI - PubMed
    1. Husband JE, Schwartz LH, Spencer J, et al. Evaluation of the response to treatment of solid tumours – a consensus statement of the International Cancer Imaging Society. Br J Cancer. 2004;90:2256–60. - PMC - PubMed

LinkOut - more resources