. 2010 Dec 3;285(49):38511-6.
doi: 10.1074/jbc.M110.162073. Epub 2010 Sep 29.

An NAADP-gated two-pore channel targeted to the plasma membrane uncouples triggering from amplifying Ca2+ signals

Affiliations

An NAADP-gated two-pore channel targeted to the plasma membrane uncouples triggering from amplifying Ca2+ signals

Eugen Brailoiu et al. J Biol Chem. .

Abstract

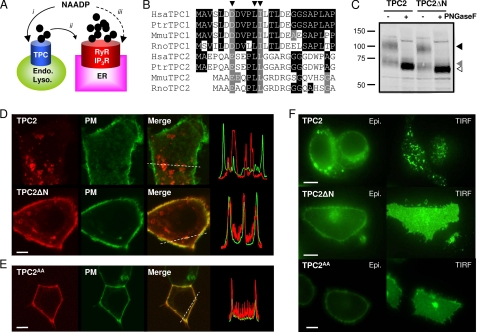
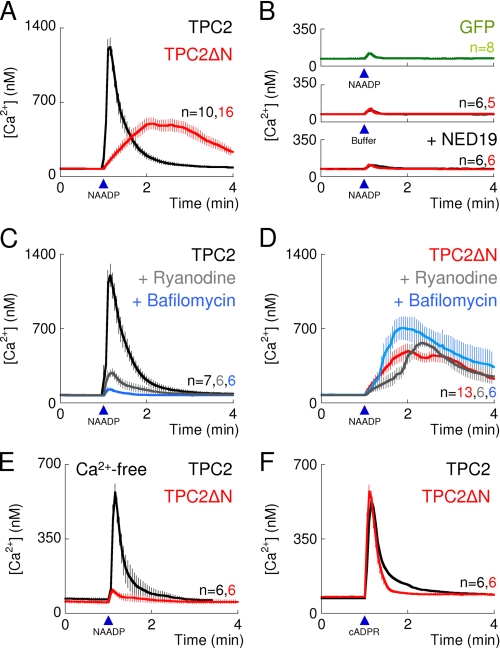
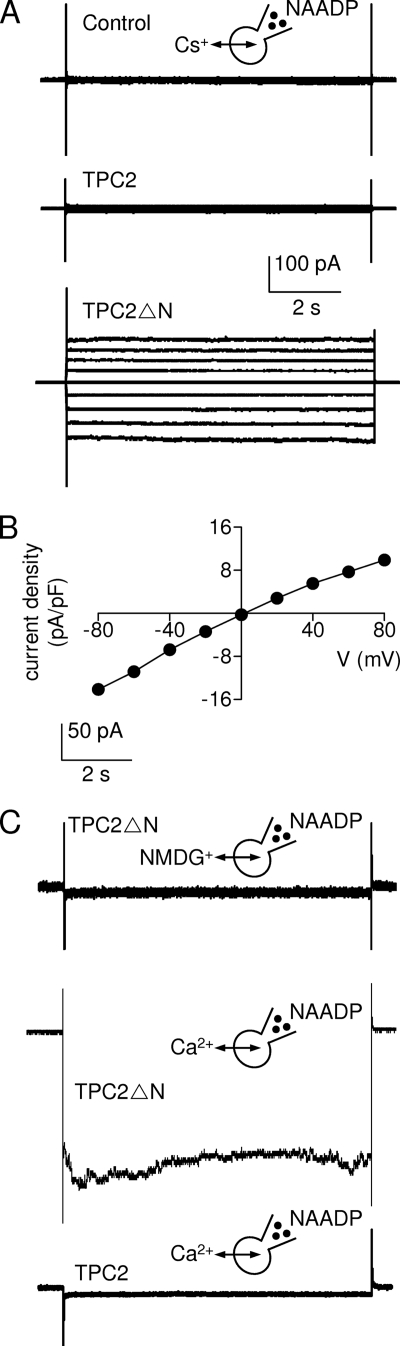
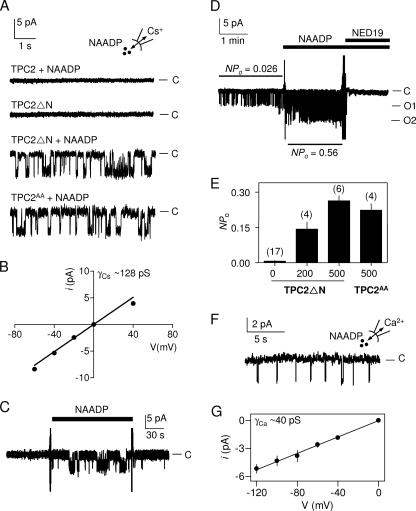
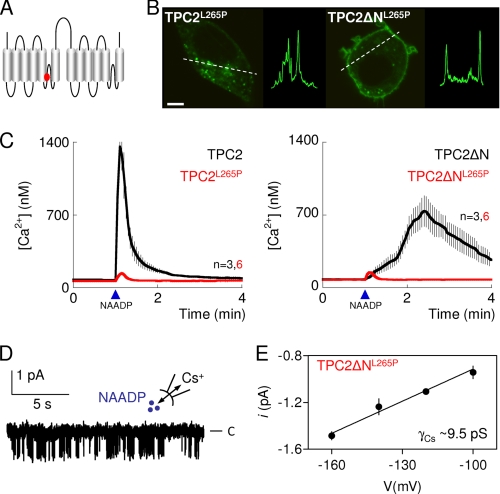
Nicotinic acid adenine dinucleotide phosphate (NAADP) is a ubiquitous messenger proposed to stimulate Ca(2+) release from acidic organelles via two-pore channels (TPCs). It has been difficult to resolve this trigger event from its amplification via endoplasmic reticulum Ca(2+) stores, fuelling speculation that archetypal intracellular Ca(2+) channels are the primary targets of NAADP. Here, we redirect TPC2 from lysosomes to the plasma membrane and show that NAADP evokes Ca(2+) influx independent of ryanodine receptors and that it activates a Ca(2+)-permeable channel whose conductance is reduced by mutation of a residue within a putative pore. We therefore uncouple TPC2 from amplification pathways and prove that it is a pore-forming subunit of an NAADP-gated Ca(2+) channel.


Figures

FIGURE 1.
FIGURE 1.
Removal of the N terminus redirects TPC2 from lysosomes to the plasma membrane. A, possible actions of NAADP. NAADP is proposed to activate TPCs on the endo-lysosomal system (i) followed by amplification of these trigger signals by ER Ca2+ channels (ii) such as ryanodine receptors (RyR) and inositol trisphosphate receptors (IP3R). Alternatively, NAADP has been proposed to activate Ca2+ release from the ER directly (iii). B, sequence alignments of Human (Hsa), chimpanzee (Ptr), mouse (Mmu) and rat (Rno) TPC N-terminal sequences highlighting a conserved dileucine endo-lysosomal targeting motif conforming to the consensus sequence (DE)XXXL(L/I) (arrowheads). C, Western blot analysis of SKBR3 cell extracts expressing GFP-tagged TPC2 or TPC2ΔN (10 μg/lane). Samples were incubated with (+) or without (−) peptide:N-glycosidase F (PNGaseF) prior to analysis. Arrowheads mark the positions of fully glycosylated (black arrowhead), core glycosylated (gray arrowhead), and deglycosylated (white arrowhead) TPC2 or TPC2ΔN. Results are representative of three experiments. D, confocal fluorescence images of SKBR3 cells coexpressing GFP-tagged human reduced folate carrier to delineate the plasma membrane (PM) and either mRFP-tagged TPC2 (top) or mRFP-tagged TPC2 lacking residues 3–25 (TPC2ΔN; bottom). Merged images are overlays of the plasma membrane marker (green) and TPC constructs (red). Transect analyses of red and green fluorescence intensities across the regions marked by dotted lines are shown on the right. E, confocal fluorescence images of HEK cells coexpressing the plasma membrane marker and mRFP-tagged TPC2 in which Leu-11 and Leu-12 were replaced with Ala (TPC2AA). F, epifluorescence (Epi.) and TIRF images of HEK cells expressing C-terminally GFP-tagged TPC2, TPC2ΔN, or TPC2AA. Images (D–F) are typical examples from samples of 15–20 cells. All scale bars, 5 μm.
FIGURE 2.
FIGURE 2.
TPC2 targeted to the plasma membrane is uncoupled from ryanodine receptors. A–F, cytosolic Ca2+ signals from individual fura-2-loaded SKBR3 cells transiently transfected with C-terminally GFP-tagged TPC2 (black traces), TPC2ΔN (red traces), or GFP alone (green). A and B, responses to microinjection (arrowheads) with NAADP (10 nm) or buffer. Cells were incubated with trans-NED19 (100 nm, 15 min) as indicated. C and D, responses to microinjection of NAADP (10 nm) from untreated cells or cells incubated with ryanodine (10 μm, 15 min) or bafilomycin A1 (1 μm, 60 min) as indicated. E, extracellular Ca2+ was removed 2–3 min before injection of NAADP. F, cells injected with cyclic ADP-ribose (cADPR, 500 nm). Results are means ± S.E. of the indicated number (n) of cells.
FIGURE 3.
FIGURE 3.
TPC2 is an NAADP-gated Ca2+-permeable cation channel. A, whole-cell recordings were performed from nontransfected HEK cells or after transient transfection with C-terminally GFP-tagged TPC2 or TPC2ΔN. With 500 nm NAADP in the pipette solution, and from a holding potential of 0 mV, the potential was switched in 20-mV increments from −80 to +80 mV, and the whole-cell currents were recorded. Results typical of 8 experiments are shown. B, from experiments similar to those in A, the current density-voltage (V) relationship for the NAADP-activated whole-cell current is shown. Results are means ± S.E., n = 6 (error bars are smaller than the symbols). C, whole-cell recordings are similar to those shown in A, but using either symmetrical Ca2+ gluconate or NMDG gluconate-based solutions as indicated. With 500 nm NAADP in the pipette solution, the inward whole-cell current was recorded in response to stepping to −140 mV from a holding potential of 0 mV. Results typical of five or three (middle trace) experiments are shown.
FIGURE 4.
FIGURE 4.
Activation of single Ca2+-permeable TPC2 channels by NAADP. A, typical recordings from excised inside-out patches from the plasma membrane of HEK cells expressing TPC2, TPC2ΔN, or TPC2AA and stimulated as indicated with NAADP (500 nm in the bathing solution). Cs+ was the charge carrier, and the holding potential was −60 mV; C denotes the closed state. Results are typical (from top to bottom) of 15, 17, 17, and 4 experiments, respectively. B, current (i)-voltage (V) relationship for the NAADP-activated channels in TPC2ΔN-expressing cells. Results are means ± S.E., n = 8. C, recording, typical of three experiments, from an excised inside-out patch from the plasma membrane of HEK cells expressing TPC2ΔN. NAADP (500 nm) was added and removed as indicated. C denotes the closed state. D, recording, typical of three similar records, from a patch excised from the plasma membrane of HEK cells expressing TPC2ΔN and treated with NAADP (500 nm) and trans-NED19 (100 nm) as indicated. Cs+ was the charge carrier, and the holding potential was −40 mV; C, O1, and O2 denote the closed state and openings of one and two channels, respectively. Note the presence of basal activity (NPo), which is increased ∼20-fold by the addition of NAADP; trans-NED19 inhibits both the basal and NAADP-evoked activity. In both C and D changes of media are accompanied by brief electrical spike artifacts. E, summary results showing NPo for excised patches of cells expressing TPC2ΔN or TPC2AA and stimulated with the indicated concentrations of NAADP (nanomolar) in the bathing solution. Results are means ± S.E., with n shown above each bar. F, record, typical of five similar records, from an excised patch expressing TPC2ΔN and with Ca2+ as the charge carrier. Pipette solution contained 500 nm NAADP, and the holding potential was −100 mV. C denotes the closed state. G, current-voltage relationship from records similar to those shown in F. Recordings were restricted to negative holding potentials to avoid activation of voltage-gated Ca2+ channels that may be endogenously expressed in HEK cells (34). Results are means ± S.E., n = 5.
FIGURE 5.
FIGURE 5.
TPC2 is the pore-forming subunit of an NAADP-gated channel. A, depiction of TPC2 showing location of a putative pore residue (Leu-265, red). B, confocal fluorescence images of SKBR3 cells expressing GFP-tagged TPC2 in which Leu-265 was replaced by proline (TPC2L265P, left) or in which this was combined with removal of the N terminus (TPC2ΔNL265P, right). Images are typical of those from 6–10 cells. Scale bar, 5 μm. Similar results with HEK cells are shown in supplemental Fig. S2E. C, cytosolic Ca2+ signals from individual fura-2-loaded SKBR3 cells transiently transfected with the indicated C-terminally GFP-tagged TPC2 constructs and microinjected with NAADP (10 nm, arrowheads). Results are means ± S.E. of the indicated number (n) of cells. D, recording, typical of four similar records, from excised inside-out patches from the plasma membrane of HEK cells expressing TPC2ΔNL265P and stimulated with 500 nm NAADP in the bathing solution with Cs+ as the charge carrier. C denotes the closed state. E, current-voltage relationship from records similar to those shown in D. Results are means ± S.E., n = 4.

References

    1. Guse A. H., Lee H. C. (2008) Sci. Signal. 1, re10. - PubMed
    1. Calcraft P. J., Ruas M., Pan Z., Cheng X., Arredouani A., Hao X., Tang J., Rietdorf K., Teboul L., Chuang K. T., Lin P., Xiao R., Wang C., Zhu Y., Lin Y., Wyatt C. N., Parrington J., Ma J., Evans A. M., Galione A., Zhu M. X. (2009) Nature 459, 596–600 - PMC - PubMed
    1. Zong X., Schieder M., Cuny H., Fenske S., Gruner C., Rötzer K., Griesbeck O., Harz H., Biel M., Wahl-Schott C. (2009) Pflugers Arch. 458, 891–899 - PMC - PubMed
    1. Brailoiu E., Churamani D., Cai X., Schrlau M. G., Brailoiu G. C., Gao X., Hooper R., Boulware M. J., Dun N. J., Marchant J. S., Patel S. (2009) J. Cell Biol. 186, 201–209 - PMC - PubMed
    1. Brailoiu E., Hooper R., Cai X., Brailoiu G. C., Keebler M. V., Dun N. J., Marchant J. S., Patel S. (2010) J. Biol. Chem. 285, 2897–2901 - PMC - PubMed

Publication types