

FoxOs function synergistically to promote glucose production
- PMID: 20880840
- PMCID: PMC2975147
- DOI: 10.1074/jbc.C110.175851
FoxOs function synergistically to promote glucose production
Abstract
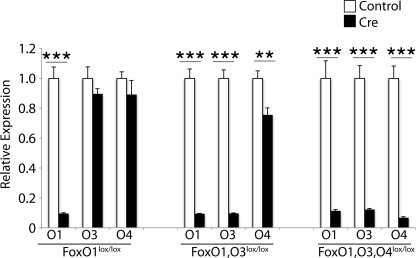
Hepatic glucose production (HGP) plays a vital role in maintaining the supply of glucose to the body, and transcription factor FoxO1 is known to confer hormone responsiveness onto HGP. Mice with a liver-specific FoxO1 deletion (L-FoxO1) show reduced HGP and reduced expression of glucose production genes. To determine the contribution of additional transcription factors to HGP, we created double and triple liver-specific knock-outs lacking FoxO1, FoxO3, and FoxO4 or the related protein FoxA2. We show that, when compared with single knock-out of FoxO1, triple ablation of FoxO genes causes more pronounced fasting hypoglycemia, increased glucose tolerance, and enhanced insulin sensitivity, with decreased plasma insulin levels. In contrast, combined ablation of FoxO1 and FoxA2 phenocopied the single knock-out of FoxO1. These data indicate that FoxOs work in concert to regulate multiple aspects of hepatic glucose metabolism.
Figures


References
Publication types
MeSH terms
Substances
Grants and funding
LinkOut - more resources
Full Text Sources
Other Literature Sources
Molecular Biology Databases
Research Materials
Miscellaneous
