

Manipulation of adenosine kinase affects sleep regulation in mice
- PMID: 20881134
- PMCID: PMC2950004
- DOI: 10.1523/JNEUROSCI.1359-10.2010
Manipulation of adenosine kinase affects sleep regulation in mice
Abstract
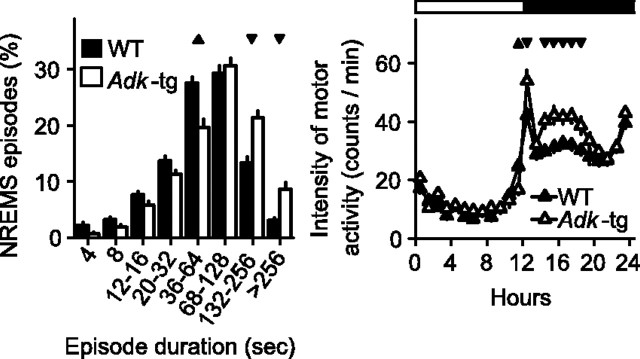
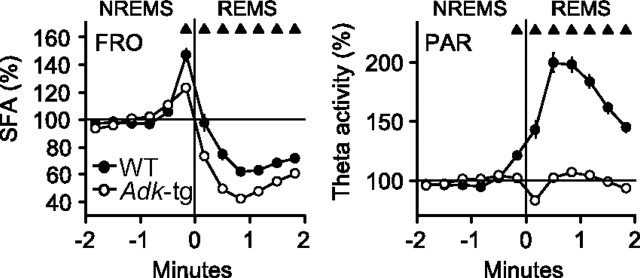
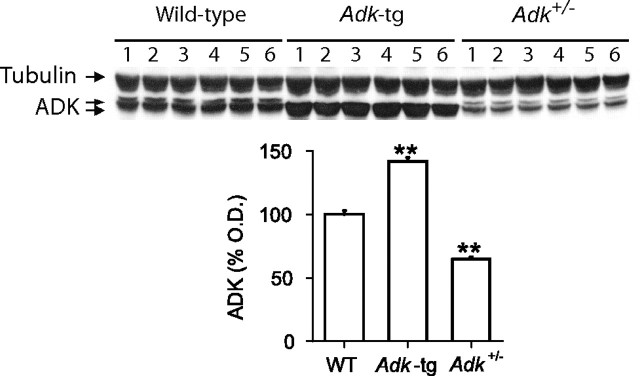
Sleep and sleep intensity are enhanced by adenosine and its receptor agonists, whereas adenosine receptor antagonists induce wakefulness. Adenosine kinase (ADK) is the primary enzyme metabolizing adenosine in adult brain. To investigate whether adenosine metabolism or clearance affects sleep, we recorded sleep in mice with engineered mutations in Adk. Adk-tg mice overexpress a transgene encoding the cytoplasmic isoform of ADK in the brain but lack the nuclear isoform of the enzyme. Wild-type mice and Adk(+/-) mice that have a 50% reduction of the cytoplasmic and the nuclear isoforms of ADK served as controls. Adk-tg mice showed a remarkable reduction of EEG power in low frequencies in all vigilance states and in theta activity (6.25-11 Hz) in rapid eye movement (REM) sleep and waking. Adk-tg mice were awake 58 min more per day than wild-type mice and spent significantly less time in REM sleep (102 ± 3 vs 128 ± 3 min in wild type). After sleep deprivation, slow-wave activity (0.75-4 Hz), the intensity component of non-rapid eye movement sleep, increased significantly less in Adk-tg mice and their slow-wave energy was reduced. In contrast, the vigilance states and EEG spectra of Adk(+/-) and wild-type mice did not differ. Our data suggest that overexpression of the cytoplasmic isoform of ADK is sufficient to alter sleep physiology. ADK might orchestrate neurotransmitter pathways involved in the generation of EEG oscillations and regulation of sleep.
Figures


Similar articles
-
Adenosine Kinase Deficiency in the Brain Results in Maladaptive Synaptic Plasticity.J Neurosci. 2016 Nov 30;36(48):12117-12128. doi: 10.1523/JNEUROSCI.2146-16.2016. J Neurosci. 2016. PMID: 27903722 Free PMC article.
-
Astrogliosis in epilepsy leads to overexpression of adenosine kinase, resulting in seizure aggravation.Brain. 2005 Oct;128(Pt 10):2383-95. doi: 10.1093/brain/awh555. Epub 2005 Jun 1. Brain. 2005. PMID: 15930047
-
An Adenosine-Mediated Glial-Neuronal Circuit for Homeostatic Sleep.J Neurosci. 2016 Mar 30;36(13):3709-21. doi: 10.1523/JNEUROSCI.3906-15.2016. J Neurosci. 2016. PMID: 27030757 Free PMC article.
-
Adenosine kinase: An epigenetic modulator in development and disease.Neurochem Int. 2021 Jul;147:105054. doi: 10.1016/j.neuint.2021.105054. Epub 2021 May 5. Neurochem Int. 2021. PMID: 33961946 Free PMC article. Review.
-
Adenosine Kinase: Cytoplasmic and Nuclear Isoforms.In: Noebels JL, Avoli M, Rogawski MA, Vezzani A, Delgado-Escueta AV, editors. Jasper's Basic Mechanisms of the Epilepsies. 5th edition. New York: Oxford University Press; 2024. Chapter 27. In: Noebels JL, Avoli M, Rogawski MA, Vezzani A, Delgado-Escueta AV, editors. Jasper's Basic Mechanisms of the Epilepsies. 5th edition. New York: Oxford University Press; 2024. Chapter 27. PMID: 39637220 Free Books & Documents. Review.
Cited by
-
Reduced neurobehavioral impairment from sleep deprivation in older adults: contribution of adenosinergic mechanisms.Front Neurol. 2012 Apr 27;3:62. doi: 10.3389/fneur.2012.00062. eCollection 2012. Front Neurol. 2012. PMID: 22557989 Free PMC article.
-
The Inside Story of Adenosine.Int J Mol Sci. 2018 Mar 9;19(3):784. doi: 10.3390/ijms19030784. Int J Mol Sci. 2018. PMID: 29522447 Free PMC article. Review.
-
Is Adenosine Action Common Ground for NREM Sleep, Torpor, and Other Hypometabolic States?Physiology (Bethesda). 2018 May 1;33(3):182-196. doi: 10.1152/physiol.00007.2018. Physiology (Bethesda). 2018. PMID: 29616880 Free PMC article. Review.
-
Adenosine kinase: A key regulator of purinergic physiology.Biochem Pharmacol. 2021 May;187:114321. doi: 10.1016/j.bcp.2020.114321. Epub 2020 Nov 6. Biochem Pharmacol. 2021. PMID: 33161022 Free PMC article. Review.
-
5'-Ectonucleotidase-knockout mice lack non-REM sleep responses to sleep deprivation.Eur J Neurosci. 2012 Jun;35(11):1789-98. doi: 10.1111/j.1460-9568.2012.08112.x. Epub 2012 Apr 29. Eur J Neurosci. 2012. PMID: 22540145 Free PMC article.
References
-
- Achermann P, Borbély AA. Mathematical models of sleep regulation. Front Biosci. 2003;8:s683–s693. - PubMed
-
- Aeschbach D, Dijk DJ, Borbély AA. Dynamics of EEG spindle frequency activity during extended sleep in humans: relationship to slow-wave activity and time of day. Brain Res. 1997;748:131–136. - PubMed
-
- Aeschbach D, Matthews JR, Postolache TT, Jackson MA, Giesen HA, Wehr TA. Two circadian rhythms in the human electroencephalogram during wakefulness. Am J Physiol. 1999;277:R1771–R1779. - PubMed
-
- Alanko L, Heiskanen S, Stenberg D, Porkka-Heiskanen T. Adenosine kinase and 5′-nucleotidase activity after prolonged wakefulness in the cortex and the basal forebrain of rat. Neurochem Int. 2003;42:449–454. - PubMed
-
- Alanko LO, Laitinen JT, Stenberg D, Porkka-Heiskanen T. Adenosine A1 receptor-dependent G-protein activity in the rat brain during prolonged wakefulness. Neuroreport. 2004;15:2133–2137. - PubMed
Publication types
MeSH terms
Substances
Grants and funding
LinkOut - more resources
Full Text Sources
Molecular Biology Databases
Miscellaneous