

Responses of primate retinal ganglion cells to perimetric stimuli
- PMID: 20881286
- PMCID: PMC3053105
- DOI: 10.1167/iovs.10-6158
Responses of primate retinal ganglion cells to perimetric stimuli
Abstract
Purpose: Perimetry is used clinically to assess glaucomatous ganglion cell loss. It has been proposed that frequency-doubling stimuli are better than the conventional size III perimetric stimulus in preferentially stimulating magnocellular (M) versus parvocellular (P) ganglion cells. However, little is known about how primate ganglion cells respond to perimetric stimuli. The authors recorded contrast responses of M and P ganglion cells to size III and frequency-doubling stimuli and compared contrast gain of M and P cells to these stimuli to assess the ability of these stimuli to preferentially stimulate M versus P cells.
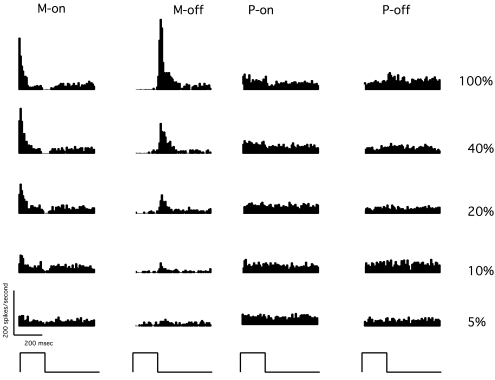
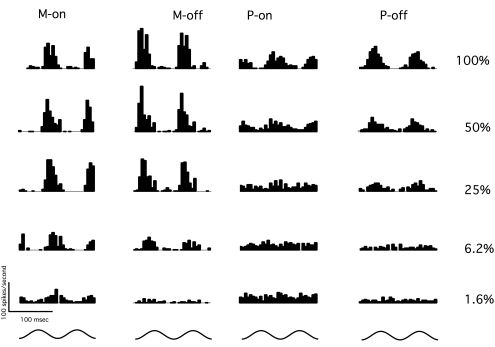
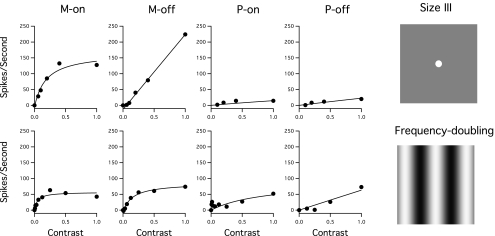
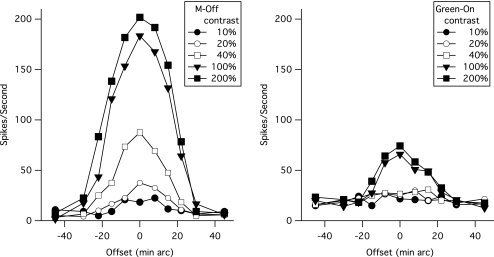
Methods: Data were recorded from 69 macaque retinal ganglion cells, by an in vivo preparation, at eccentricities of 5° to 15°. The size III stimulus was a circular luminance increment 26 min arc in diameter, 200 ms in duration. The frequency-doubling stimulus was a sinusoidal grating (0.5 cyc/deg) temporally modulated in counterphase at 13 Hz. A Michaelis-Menten function was fit to each cell's contrast responses to assess contrast gain.
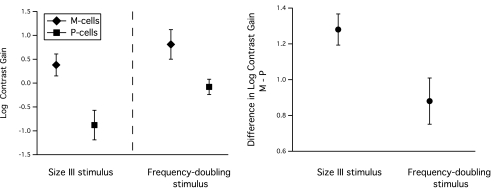
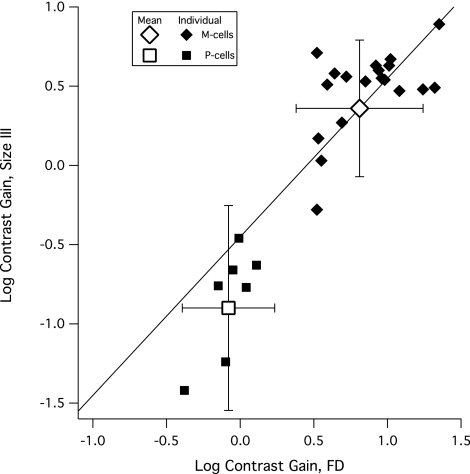
Results: For both size III and frequency-doubling stimuli, ganglion cell responses increased linearly at low contrasts, and then the increase slowed at high contrasts (saturation). The mean (± SE) difference in estimated log contrast gain between M and P cells for the size III stimulus was significantly higher than that for the frequency-doubling stimulus (1.24 ± 0.09 vs. 0.89 ± 0.13; P < 0.01).
Conclusions: The size III stimulus was superior to the frequency-doubling stimulus in preferentially stimulating M cells versus P cells.
Figures
Comment in
-
Frequency-doubling technology and parasol cells.Invest Ophthalmol Vis Sci. 2011 Jun 1;52(6):3759; author reply 3759-60. doi: 10.1167/iovs.11-7405. Invest Ophthalmol Vis Sci. 2011. PMID: 21632705 Free PMC article. No abstract available.
References
-
- Goldmann H. Fundamentals of exact perimetry. Optom Vis Sci. 1999;76:599–604 - PubMed
-
- Anderson DR, Patella VM. Automated Static Perimetry. 2nd ed. St. Louis: Mosby-Year Book; 1999
-
- Quigley HA, Dunkelberger GR, Green WR. Retinal ganglion cell atrophy correlated with automated perimetry in human eyes with glaucoma. Am J Ophthalmol. 1989;107:453–464 - PubMed
-
- Glovinsky Y, Quigley HA, Pease ME. Foveal ganglion cell loss is size dependent in experimental glaucoma. Invest Ophthalmol Vis Sci. 1993;34:395–400 - PubMed
-
- Vickers JC, Schumer RA, Podos SMW, RF Riederer BM, Morrison JH. Differential vulnerability of neurochemically identified subpopulations of retinal neurons in a monkey model of glaucoma. Brain Res. 1995;680:23–35 - PubMed
Publication types
MeSH terms
Grants and funding
LinkOut - more resources
Full Text Sources
