

Potential novel mechanism for Axenfeld-Rieger syndrome: deletion of a distant region containing regulatory elements of PITX2
- PMID: 20881290
- PMCID: PMC3101680
- DOI: 10.1167/iovs.10-6060
Potential novel mechanism for Axenfeld-Rieger syndrome: deletion of a distant region containing regulatory elements of PITX2
Abstract
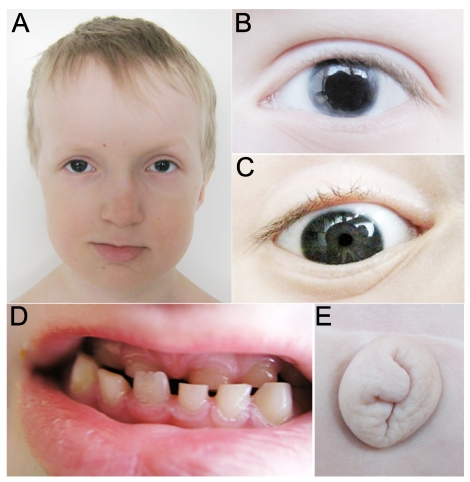
Purpose: Mutations in PITX2 are associated with Axenfeld-Rieger syndrome (ARS), which involves ocular, dental, and umbilical abnormalities. Identification of cis-regulatory elements of PITX2 is important to better understand the mechanisms of disease.
Methods: Conserved noncoding elements surrounding PITX2/pitx2 were identified and examined through transgenic analysis in zebrafish; expression pattern was studied by in situ hybridization. Patient samples were screened for deletion/duplication of the PITX2 upstream region using arrays and probes.
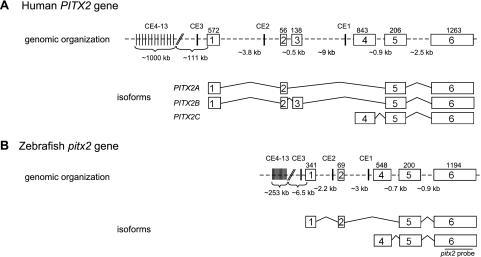
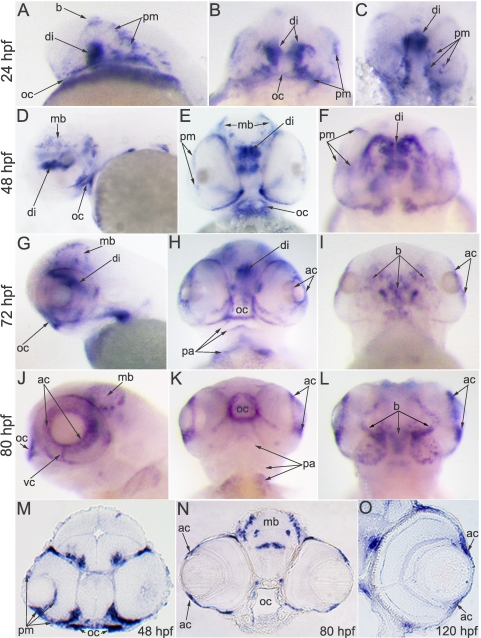
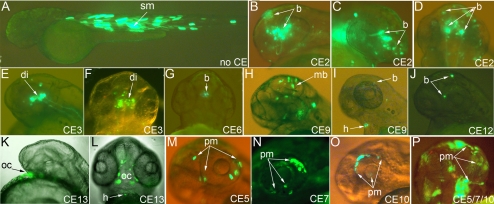
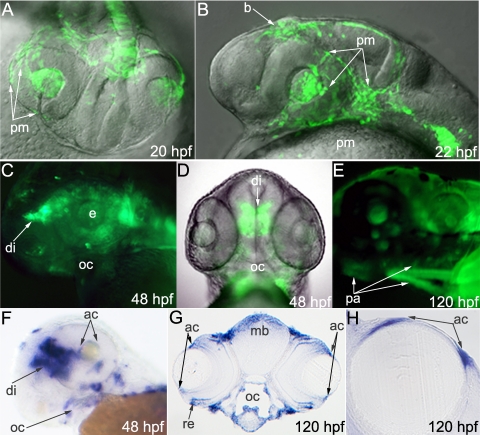
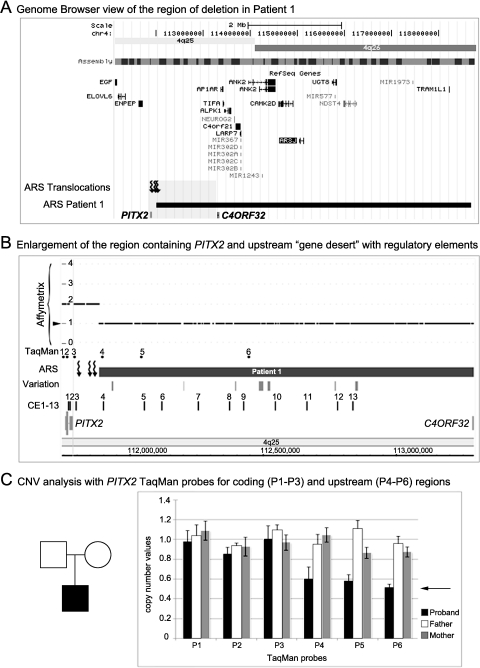
Results: Zebrafish pitx2 demonstrates conserved expression during ocular and craniofacial development. Thirteen conserved noncoding sequences positioned within a gene desert as far as 1.1 Mb upstream of the human PITX2 gene were identified; 11 have enhancer activities consistent with pitx2 expression. Ten elements mediated expression in the developing brain, four regions were active during eye formation, and two sequences were associated with craniofacial expression. One region, CE4, located approximately 111 kb upstream of PITX2, directed a complex pattern including expression in the developing eye and craniofacial region, the classic sites affected in ARS. Screening of ARS patients identified an approximately 7600-kb deletion that began 106 to 108 kb upstream of the PITX2 gene, leaving PITX2 intact while removing regulatory elements CE4 to CE13.
Conclusions: These data suggest the presence of a complex distant regulatory matrix within the gene desert located upstream of PITX2 with an essential role in its activity and provides a possible mechanism for the previous reports of ARS in patients with balanced translocations involving the 4q25 region upstream of PITX2 and the current patient with an upstream deletion.
Figures
Similar articles
-
Mechanistic Insights into Axenfeld-Rieger Syndrome from Zebrafish foxc1 and pitx2 Mutants.Int J Mol Sci. 2021 Sep 16;22(18):10001. doi: 10.3390/ijms221810001. Int J Mol Sci. 2021. PMID: 34576164 Free PMC article. Review.
-
A zebrafish model of axenfeld-rieger syndrome reveals that pitx2 regulation by retinoic acid is essential for ocular and craniofacial development.Invest Ophthalmol Vis Sci. 2012 Jan 3;53(1):7-22. doi: 10.1167/iovs.11-8494. Invest Ophthalmol Vis Sci. 2012. PMID: 22125274 Free PMC article.
-
Novel PITX2 gene mutations in patients with Axenfeld-Rieger syndrome.Acta Ophthalmol. 2016 Nov;94(7):e571-e579. doi: 10.1111/aos.13030. Epub 2016 Mar 24. Acta Ophthalmol. 2016. PMID: 27009473
-
Novel c.300_301delinsT mutation in PITX2 in a Korean family with Axenfeld-Rieger syndrome.Ann Lab Med. 2013 Sep;33(5):360-3. doi: 10.3343/alm.2013.33.5.360. Epub 2013 Aug 8. Ann Lab Med. 2013. PMID: 24003428 Free PMC article.
-
Complex genomic rearrangement with deletion of PITX2 in a Chinese family with Axenfeld-Rieger syndrome: A case report and literature review.Mol Vis. 2024 Dec 31;30:466-476. eCollection 2024. Mol Vis. 2024. PMID: 39959165 Free PMC article. Review.
Cited by
-
Complex balanced intrachromosomal rearrangement involving PITX2 identified as a cause of Axenfeld-Rieger Syndrome.Am J Med Genet A. 2024 May;194(5):e63542. doi: 10.1002/ajmg.a.63542. Epub 2024 Jan 17. Am J Med Genet A. 2024. PMID: 38234180 Free PMC article.
-
Axenfeld-Rieger syndrome associated with a megabase-scale inversion separating PITX2 from a conserved enhancer locus.medRxiv [Preprint]. 2025 Jun 6:2025.06.05.25327661. doi: 10.1101/2025.06.05.25327661. medRxiv. 2025. PMID: 40502565 Free PMC article. Preprint.
-
Enhancers: bridging the gap between gene control and human disease.Hum Mol Genet. 2018 Aug 1;27(R2):R219-R227. doi: 10.1093/hmg/ddy167. Hum Mol Genet. 2018. PMID: 29726898 Free PMC article. Review.
-
Relationship between neural crest cell specification and rare ocular diseases.J Neurosci Res. 2019 Jan;97(1):7-15. doi: 10.1002/jnr.24245. Epub 2018 Apr 16. J Neurosci Res. 2019. PMID: 29660784 Free PMC article. Review.
-
Mechanistic Insights into Axenfeld-Rieger Syndrome from Zebrafish foxc1 and pitx2 Mutants.Int J Mol Sci. 2021 Sep 16;22(18):10001. doi: 10.3390/ijms221810001. Int J Mol Sci. 2021. PMID: 34576164 Free PMC article. Review.
References
-
- Semina EV, Reiter R, Leysens NJ, et al. Cloning and characterization of a novel bicoid-related homeobox transcription factor gene, RIEG, involved in Rieger syndrome. Nat Genet. 1996;14:392–399 - PubMed
-
- Lines MA, Kozlowski K, Kulak SC, et al. Characterization and prevalence of PITX2 microdeletions and mutations in Axenfeld-Rieger malformations. Invest Ophthalmol Vis Sci. 2004;45:828–833 - PubMed
-
- Lines MA, Kozlowski K, Walter MA. Molecular genetics of Axenfeld-Rieger malformations. Hum Mol Genet. 2002;11:1177–1184 - PubMed
-
- Footz T, Idrees F, Acharya M, Kozlowski K, Walter MA. Analysis of mutations of the PITX2 transcription factor found in patients with Axenfeld-Rieger syndrome. Invest Ophthalmol Vis Sci. 2009;50:2599–2606 - PubMed
Publication types
MeSH terms
Substances
Supplementary concepts
Grants and funding
LinkOut - more resources
Full Text Sources
Molecular Biology Databases
Miscellaneous
