Initial arcuate defects within the central 10 degrees in glaucoma
- PMID: 20881293
- PMCID: PMC3053114
- DOI: 10.1167/iovs.10-5803
Initial arcuate defects within the central 10 degrees in glaucoma
Abstract
Purpose: To better understand the relationship between the spatial patterns of functional (visual field [VF] loss) and structural (axon loss) abnormalities in patients with glaucomatous arcuate defects largely confined to the central 10° on achromatic perimetry.
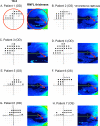
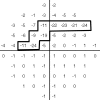
Methods: Eleven eyes (9 patients) with arcuate glaucomatous VF defects largely confined to the macula were selected from a larger group of patients with both 10-2 and 24-2 VF tests. Eyes were included if their 10-2 VF had an arcuate defect and if the 24-2 test was normal outside the central 10° (i.e., did not have a cluster of three contiguous points within a hemifield). For the structural analysis, plots of retinal nerve fiber layer (RNFL) thickness of the macula were obtained with frequency-domain optical coherence tomography (fdOCT). The optic disc locations of the RNFL defects were identified on peripapillary fdOCT scans.
Results: The VF arcuate defects extended to within 1° of fixation on the 10-2 test and were present in the superior hemifield in 10 of the 11 eyes. The arcuate RNFL damage, seen in the macular fdOCT scans of all 11 eyes, involved the temporal and inferior temporal portions of the disc on the peripapillary scans.
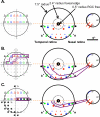
Conclusions: Glaucomatous arcuate defects of the macula's RNFL meet the disc temporal to the peak of the main arcuate bundles and produce a range of macular VF defects from clear arcuate scotomas to a papillofoveal horizontal step ("pistol barrel scotoma"). If RGC displacement is taken into consideration, the RNFL and VF defects can be compared directly.
Figures


References
-
- Araie M. Pattern of visual field defect in normal-tension and high tension glaucoma. Curr Opin Ophthalmol. 1995;6:36–45 - PubMed
-
- Anctil J-L, Anderson DR. Early foveal involvement and generalized depression of the visual field in glaucoma. Arch Ophthalmol. 1984;102:363–370 - PubMed
-
- Koseki N, Araie M, Yamagami J, Suzuki Y. Sectorization of central 10-deg visual field in open-angle glaucoma. An approach for its brief evaluation. Graefes Arch Clin Exp Ophthalmol. 1995;233:621–626 - PubMed
-
- Langerhorst CT, Carenini LL, Bakker D, De Bie-Raakman MAC. Measurements for description of very early glaucomatous field defects. In: Wall M, Heiji A. eds. Perimetry Update 1996/1997. New York, NY: Kugler Publications; 1997:67–73
Publication types
MeSH terms
Grants and funding
LinkOut - more resources
Full Text Sources
Medical

