

Extensive disease small cell lung cancer dose-response relationships: implications for resistance mechanisms
- PMID: 20881640
- PMCID: PMC2966343
- DOI: 10.1097/JTO.0b013e3181f387c7
Extensive disease small cell lung cancer dose-response relationships: implications for resistance mechanisms
Abstract
Background: Some studies (but not others) suggested that high doses are beneficial in small cell lung cancer (SCLC). We hypothesized that dose-response curve (DRC) shape reflects resistance mechanisms.
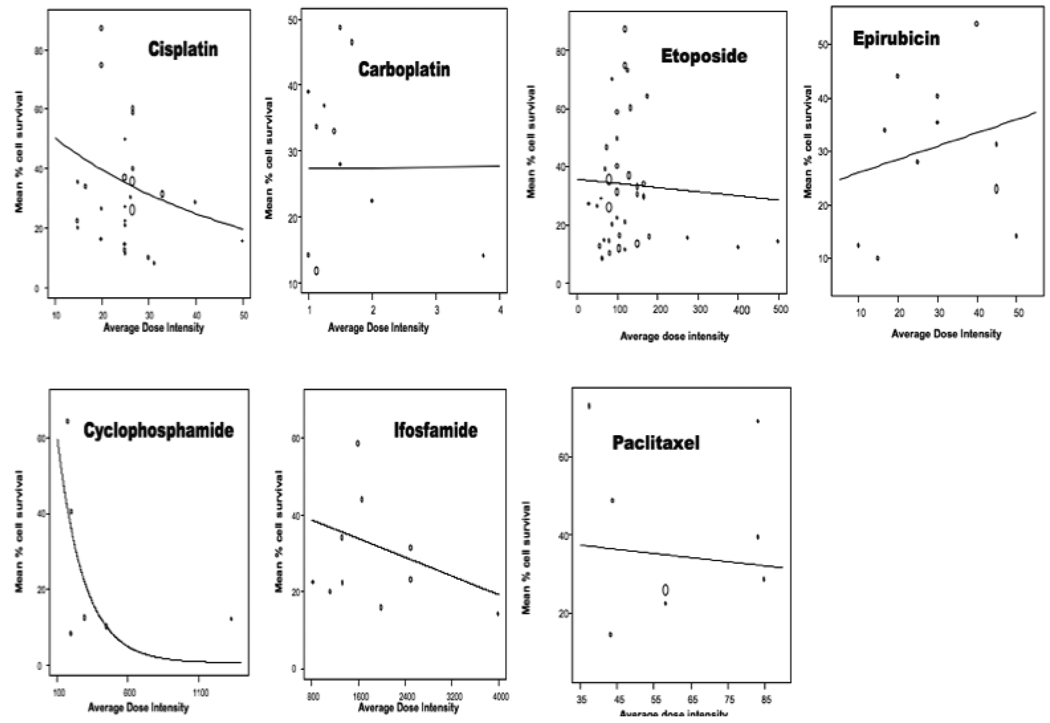
Methods: We reviewed published SCLC clinical trials and converted response rates into estimated mean tumor cell kill, assuming killing is proportional to reduction in tumor volume. Mean % cell survival was plotted versus planned dose intensity. Nonlinear and linear meta-regression analyses (weighted according to the number of patients in each study) were used to assess DRC characteristics.
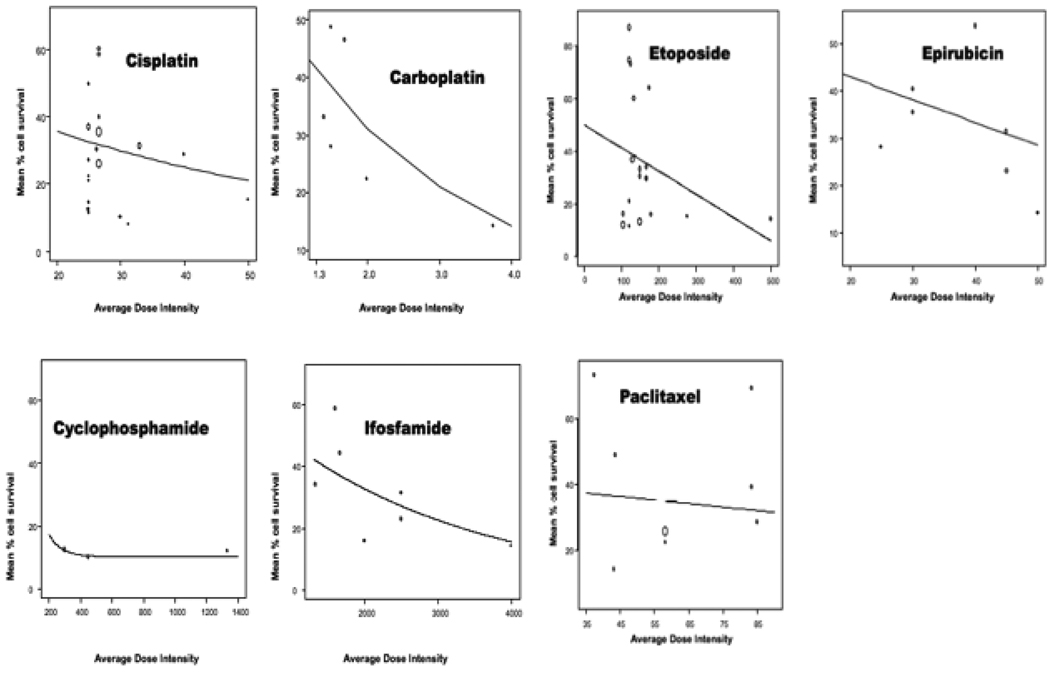
Results: Although associations between dose and cell survival were not statistically significant, DRCs sloped downward for five of seven agents across all doses and for all seven when lowest doses were excluded. Maximum mean cell kill across all drugs and doses was approximately 90%, suggesting that there may be a maximum achievable tumor cell kill irrespective of number of agents or drug doses.
Conclusions: Downward DRC slopes suggest that maintaining relatively high doses may possibly maximize palliation, although the associations between dose and slope did not achieve statistical significance, and slopes for most drugs tended to be shallow. DRC flattening at higher doses would preclude cure and would suggest that "saturable passive resistance" (deficiency of factors required for cell killing) limits maximum achievable cell kill. An example of factors that could flatten the DRC at higher doses and lead to saturable passive resistance would be presence of quiescent, noncycling cells.
Figures

Similar articles
-
Chemotherapy dose--response relationships in non-small cell lung cancer and implied resistance mechanisms.Cancer Treat Rev. 2007 Apr;33(2):101-37. doi: 10.1016/j.ctrv.2006.12.002. Epub 2007 Feb 5. Cancer Treat Rev. 2007. PMID: 17276603 Review.
-
Rovalpituzumab tesirine, a DLL3-targeted antibody-drug conjugate, in recurrent small-cell lung cancer: a first-in-human, first-in-class, open-label, phase 1 study.Lancet Oncol. 2017 Jan;18(1):42-51. doi: 10.1016/S1470-2045(16)30565-4. Epub 2016 Dec 5. Lancet Oncol. 2017. PMID: 27932068 Free PMC article. Clinical Trial.
-
The effect of brassinolide, a plant steroid hormone, on drug resistant small-cell lung carcinoma cells.Biochem Biophys Res Commun. 2017 Nov 4;493(1):783-787. doi: 10.1016/j.bbrc.2017.08.094. Epub 2017 Aug 25. Biochem Biophys Res Commun. 2017. PMID: 28847728
-
Pemetrexed in relapsed small-cell lung cancer and the impact of shortened vitamin supplementation lead-in time: results of a phase II trial.J Thorac Oncol. 2008 Nov;3(11):1308-16. doi: 10.1097/JTO.0b013e3181898e32. J Thorac Oncol. 2008. PMID: 18978567 Clinical Trial.
-
Extensive-stage small-cell lung cancer: evolution of systemic therapy and future directions.Clin Lung Cancer. 2008 Sep;9(5):262-70. doi: 10.3816/CLC.2008.n.041. Clin Lung Cancer. 2008. PMID: 18953759 Review.
Cited by
-
The new concepts on overcoming drug resistance in lung cancer.Drug Des Devel Ther. 2014 Jun 6;8:735-44. doi: 10.2147/DDDT.S60672. eCollection 2014. Drug Des Devel Ther. 2014. PMID: 24944510 Free PMC article. Review.
-
Prediction of Short and Long Survival after Surgery for Breast Cancer Brain Metastases.Cancers (Basel). 2022 Mar 10;14(6):1437. doi: 10.3390/cancers14061437. Cancers (Basel). 2022. PMID: 35326590 Free PMC article.
References
-
- Crivellari G, Monfardini S, Stragliotto S, Marino D, Aversa SM. Increasing chemotherapy in small-cell lung cancer: from dose intensity and density to megadoses. Oncologist. 2007;12:79–89. - PubMed
-
- Jackman DM, Johnson BE. Small-cell lung cancer. Lancet. 2005;366:1385–1396. - PubMed
-
- Mascaux C, Paesmans M, Berghmans T, et al. A systematic review of the role of etoposide and cisplatin in the chemotherapy of small cell lung cancer with methodology assessment and meta-analysis. Lung Cancer. 2000;30:23–36. - PubMed
-
- Kurup A, Hanna NH. Treatment of small cell lung cancer. Crit Rev Oncol Hematol. 2004;52:117–126. - PubMed
-
- Chua YJ, Steer C, Yip D. Recent advances in management of small-cell lung cancer. Cancer Treat Rev. 2004;30:521–543. - PubMed
Publication types
MeSH terms
Substances
Grants and funding
LinkOut - more resources
Full Text Sources
Medical
