Longitudinal and multi-echo transverse relaxation times of normal breast tissue at 3 Tesla
- PMID: 20882630
- PMCID: PMC3154635
- DOI: 10.1002/jmri.22306
Longitudinal and multi-echo transverse relaxation times of normal breast tissue at 3 Tesla
Abstract
Purpose: To measure longitudinal (T(1)) and multi-echo transverse (T(2)) relaxation times of healthy breast tissue at 3 Tesla (T).
Materials and methods: High-resolution relaxation time measurements were made in six healthy female subjects. Inversion recovery images were acquired at 10 inversion times between 100 ms and 4000 ms, and multiple spin echo images were acquired at 16 echo times between 10 ms and 160 ms.
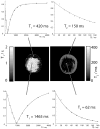
Results: Longitudinal relaxation times T(1) were measured as 423 ± 12 ms for adipose tissue and 1680 ± 180 ms for fibroglandular tissue. Multi-echo transverse relaxation times T(2) were measured as 154 ± 9 ms for adipose tissue and 71 ± 6 ms for fibroglandular tissue. Histograms of the voxel-wise relaxation times and quantitative relaxation time maps are also presented.
Conclusion: T(1) and multi-echo T(2) relaxation times in normal human breast tissue are reported. These values are useful for pulse sequence design and optimization for 3T breast MRI. Compared with the literature, T(1) values are significantly longer at 3T, suggesting that longer repetition time and inversion time values should be used for similar image contrast.
Figures


References
-
- Lehman CD, Smith RA. The role of MRI in breast cancer screening. J Natl Compr Canc Netw. 2009;7:1109–1115. - PubMed
-
- Schnall MD, Blume J, Bluemke DA, et al. MRI detection of distinct incidental cancer in women with primary breast cancer studied in IBMC 6883. J Surg Oncol. 2005;92:32–38. - PubMed
-
- Lehman CD, Gatsonis C, Kuhl CK, et al. MRI evaluation of the contralateral breast in women with recently diagnosed breast cancer. N Engl J Med. 2007;356:1295–1303. - PubMed
-
- Patani N, Mokbel K. The utility of MRI for the screening and staging of breast cancer. Int J Clin Pract. 2008;62:450–453. - PubMed
MeSH terms
Grants and funding
LinkOut - more resources
Full Text Sources
Other Literature Sources
Medical

