

Nitrile bonds as infrared probes of electrostatics in ribonuclease S
- PMID: 20883003
- PMCID: PMC2959148
- DOI: 10.1021/jp106406p
Nitrile bonds as infrared probes of electrostatics in ribonuclease S
Abstract
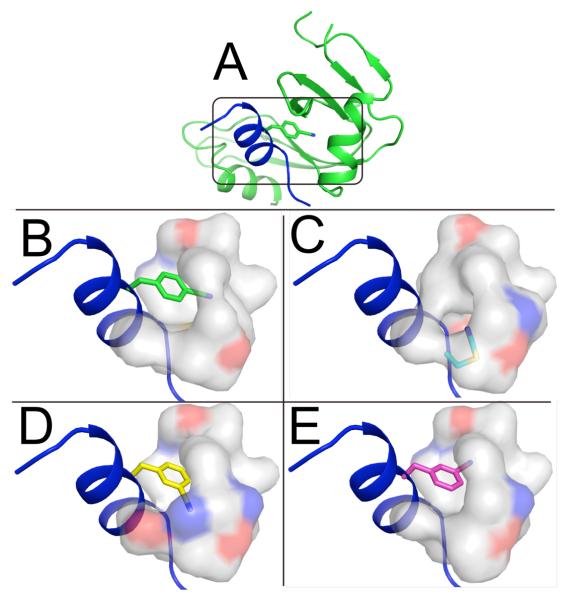
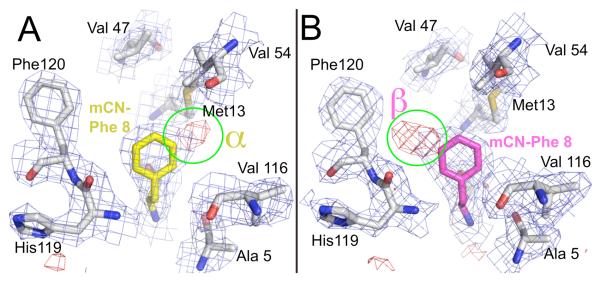
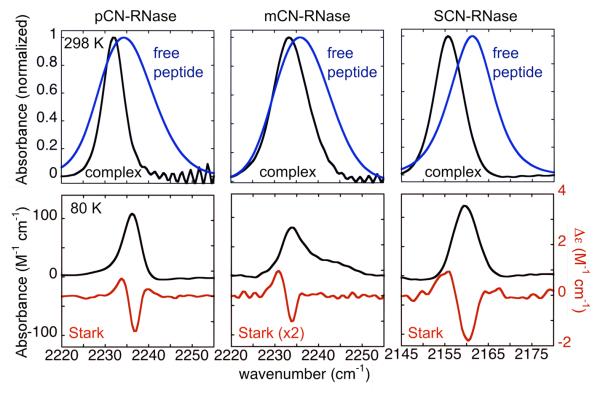
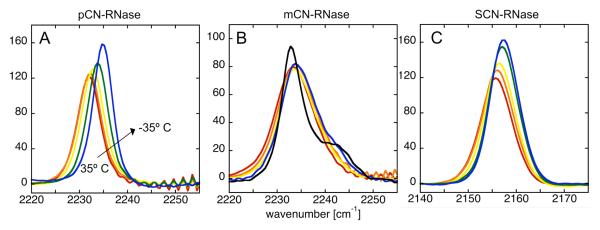
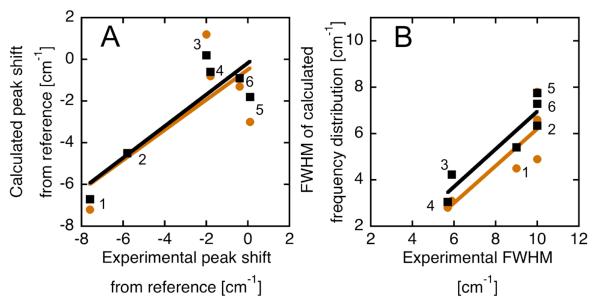
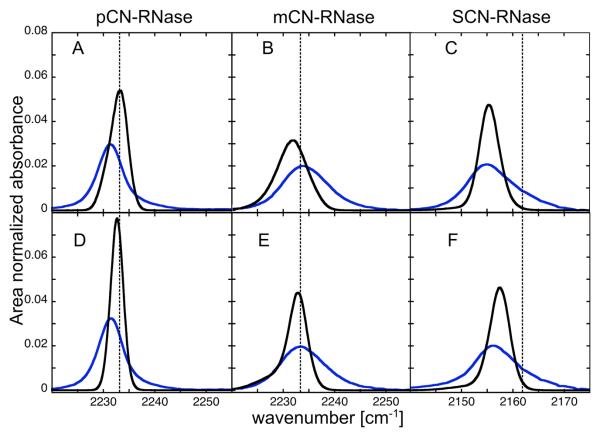
Three different nitrile-containing amino acids, p-cyanophenylalanine, m-cyanophenylalanine, and S-cyanohomocysteine, have been introduced near the active site of the semisynthetic enzyme ribonuclease S (RNase S) to serve as probes of electrostatic fields. Vibrational Stark spectra, measured directly on the probe-modified proteins, confirm the predominance of the linear Stark tuning rate in describing the sensitivity of the nitrile stretch to external electric fields, a necessary property for interpreting observed frequency shifts as a quantitative measure of local electric fields that can be compared with simulations. The X-ray structures of these nitrile-modified RNase variants and enzymatic assays demonstrate minimal perturbation to the structure and function, respectively, by the probes and provide a context for understanding the influence of the environment on the nitrile stretching frequency. We examine the ability of simulation techniques to recapitulate the spectroscopic properties of these nitriles as a means to directly test a computational electrostatic model for proteins, specifically that in the ubiquitous Amber-99 force field. Although qualitative agreement between theory and experiment is observed for the largest shifts, substantial discrepancies are observed in some cases, highlighting the ongoing need for experimental metrics to inform the development of theoretical models of electrostatic fields in proteins.
Figures
Similar articles
-
A solvatochromic model calibrates nitriles' vibrational frequencies to electrostatic fields.J Am Chem Soc. 2012 Jun 27;134(25):10373-6. doi: 10.1021/ja303895k. Epub 2012 Jun 15. J Am Chem Soc. 2012. PMID: 22694663 Free PMC article.
-
Nitrile Probes of Electric Field Agree with Independently Measured Fields in Green Fluorescent Protein Even in the Presence of Hydrogen Bonding.J Am Chem Soc. 2016 May 25;138(20):6561-70. doi: 10.1021/jacs.6b02156. Epub 2016 May 11. J Am Chem Soc. 2016. PMID: 27128688
-
Ribonuclease S dynamics measured using a nitrile label with 2D IR vibrational echo spectroscopy.J Phys Chem B. 2012 Apr 5;116(13):4034-42. doi: 10.1021/jp2122856. Epub 2012 Mar 23. J Phys Chem B. 2012. PMID: 22417088 Free PMC article.
-
Nitrile groups as vibrational probes of biomolecular structure and dynamics: an overview.Phys Chem Chem Phys. 2009 Oct 1;11(37):8119-32. doi: 10.1039/b908588b. Epub 2009 Jul 31. Phys Chem Chem Phys. 2009. PMID: 19756266 Review.
-
Measuring Electric Fields in Biological Matter Using the Vibrational Stark Effect of Nitrile Probes.Annu Rev Phys Chem. 2018 Apr 20;69:253-271. doi: 10.1146/annurev-physchem-052516-045011. Annu Rev Phys Chem. 2018. PMID: 29677466 Review.
Cited by
-
Measuring electrostatic fields in both hydrogen-bonding and non-hydrogen-bonding environments using carbonyl vibrational probes.J Am Chem Soc. 2013 Jul 31;135(30):11181-92. doi: 10.1021/ja403917z. Epub 2013 Jul 18. J Am Chem Soc. 2013. PMID: 23808481 Free PMC article.
-
Two-dimensional infrared spectroscopy of azido-nicotinamide adenine dinucleotide in water.J Chem Phys. 2011 Aug 7;135(5):055106. doi: 10.1063/1.3623418. J Chem Phys. 2011. PMID: 21823737 Free PMC article.
-
Inhomogeneity of Interfacial Electric Fields at Vibrational Probes on Electrode Surfaces.ACS Cent Sci. 2020 Feb 26;6(2):304-311. doi: 10.1021/acscentsci.9b01297. Epub 2020 Feb 3. ACS Cent Sci. 2020. PMID: 32123749 Free PMC article.
-
Measuring electric fields and noncovalent interactions using the vibrational stark effect.Acc Chem Res. 2015 Apr 21;48(4):998-1006. doi: 10.1021/ar500464j. Epub 2015 Mar 23. Acc Chem Res. 2015. PMID: 25799082 Free PMC article.
-
Extended timescale 2D IR probes of proteins: p-cyanoselenophenylalanine.Phys Chem Chem Phys. 2017 Apr 12;19(15):10081-10086. doi: 10.1039/c7cp00403f. Phys Chem Chem Phys. 2017. PMID: 28367555 Free PMC article.
References
-
- Watson MD, Gai XS, Gillies AT, Brewer SH, Fenlon EE. J. Phys. Chem. B. 2008;112:13188–13192. - PubMed
-
- Getahun Z, Huang CY, Wang T, De Leon B, DeGrado WF, Gai F. J. Am. Chem. Soc. 2003;125:405–411. - PubMed
-
- Kirshenbaum K, Carrico IS, Tirrell DA. ChemBioChem. 2002;3:235–237. - PubMed
-
- Schultz KC, Supekova L, Ryu Y, Xie J, Perera R, Schultz PG. J. Am. Chem. Soc. 2006;128:13984–13985. - PubMed
Publication types
MeSH terms
Substances
Grants and funding
LinkOut - more resources
Full Text Sources
