

Porcine reproductive and respiratory syndrome virus-induced immunosuppression exacerbates the inflammatory response to porcine respiratory coronavirus in pigs
- PMID: 20883160
- PMCID: PMC2967820
- DOI: 10.1089/vim.2010.0051
Porcine reproductive and respiratory syndrome virus-induced immunosuppression exacerbates the inflammatory response to porcine respiratory coronavirus in pigs
Abstract
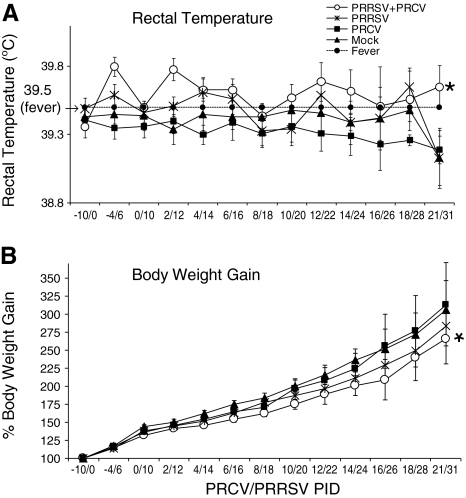
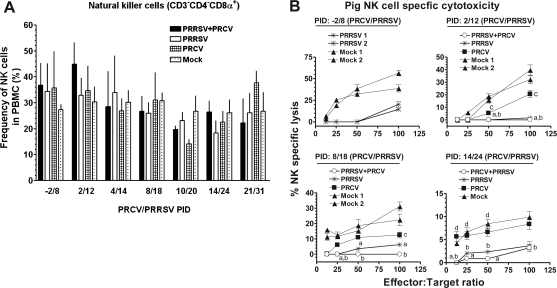
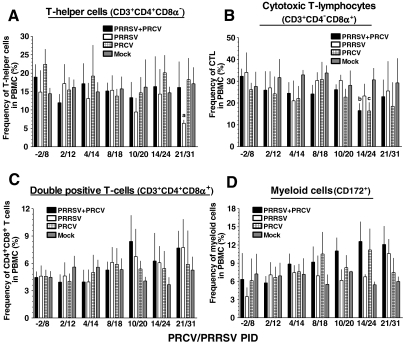
We performed a comprehensive analysis of innate and adaptive immune responses in dual-virus infected pigs to understand whether a pre-existing immunomodulatory respiratory viral infection affects the overall immunity to a subsequent porcine respiratory coronavirus (PRCV) infection in pigs. Pigs were either mock-infected or infected with porcine reproductive and respiratory syndrome virus (PRRSV), a virus known to cause immunosuppressive respiratory disease, and then pigs were co-infected with PRCV, which normally causes subclinical respiratory infection. We collected samples for six independent experiments from 178 pigs that were also used for pathological studies. We detected a significant reduction in innate NK-cell-mediated cytotoxic function in PRRSV-infected pigs, which was synergistically further decreased in pigs co-infected with PRCV. Subsequently, in association with clinical signs we observed elevated levels of proinflammatory (IL-6), Th-1 (IL-12), and regulatory (IL-10 and TGF-β) cytokines. Increased frequencies of CD4CD8 double-positive T lymphocytes and myeloid cells, in addition to the elevated Th-1 and proinflammatory cytokines in dual-infected pigs, contributed to the severity of lung disease in pigs. The results of our study clarify how each virus modulates the host innate and adaptive immune responses, leading to inflammatory reactions and lung pathology. Thus measurements of cytokines and frequencies of immune cells may serve as indicators of the progression of respiratory viral co-infections, and provide more definitive approaches for treatment.
Figures
Similar articles
-
Porcine reproductive and respiratory syndrome virus modifies innate immunity and alters disease outcome in pigs subsequently infected with porcine respiratory coronavirus: implications for respiratory viral co-infections.J Gen Virol. 2009 Nov;90(Pt 11):2713-2723. doi: 10.1099/vir.0.014001-0. Epub 2009 Aug 5. J Gen Virol. 2009. PMID: 19656969 Free PMC article.
-
Nitric oxide is elicited and inhibits viral replication in pigs infected with porcine respiratory coronavirus but not porcine reproductive and respiratory syndrome virus.Vet Immunol Immunopathol. 2010 Aug 15;136(3-4):335-9. doi: 10.1016/j.vetimm.2010.03.022. Epub 2010 Apr 1. Vet Immunol Immunopathol. 2010. PMID: 20409593 Free PMC article.
-
Evaluation of immune responses to porcine reproductive and respiratory syndrome virus in pigs during early stage of infection under farm conditions.Virol J. 2012 Feb 16;9:45. doi: 10.1186/1743-422X-9-45. Virol J. 2012. PMID: 22340040 Free PMC article.
-
Proinflammatory cytokines and viral respiratory disease in pigs.Vet Res. 2000 Mar-Apr;31(2):187-213. doi: 10.1051/vetres:2000113. Vet Res. 2000. PMID: 10779199 Review.
-
In vivo studies on cytokine involvement during acute viral respiratory disease of swine: troublesome but rewarding.Vet Immunol Immunopathol. 2002 Sep 10;87(3-4):161-8. doi: 10.1016/s0165-2427(02)00047-8. Vet Immunol Immunopathol. 2002. PMID: 12072230 Free PMC article. Review.
Cited by
-
Mycobacterium tuberculosis whole cell lysate enhances proliferation of CD8 positive lymphocytes and nitric oxide secretion in the lungs of live porcine respiratory and reproductive syndrome virus vaccinated pigs.Viral Immunol. 2013 Feb;26(1):102-8. doi: 10.1089/vim.2012.0065. Epub 2013 Jan 11. Viral Immunol. 2013. PMID: 23308386 Free PMC article.
-
Swine influenza H1N1 virus induces acute inflammatory immune responses in pig lungs: a potential animal model for human H1N1 influenza virus.J Virol. 2010 Nov;84(21):11210-8. doi: 10.1128/JVI.01211-10. Epub 2010 Aug 18. J Virol. 2010. PMID: 20719941 Free PMC article.
-
Natural killer cells in host defense against veterinary pathogens.Vet Immunol Immunopathol. 2015 Nov 15;168(1-2):30-4. doi: 10.1016/j.vetimm.2015.10.001. Epub 2015 Oct 9. Vet Immunol Immunopathol. 2015. PMID: 26553564 Free PMC article. Review.
-
CD163 Antibodies Inhibit PRRSV Infection via Receptor Blocking and Transcription Suppression.Vaccines (Basel). 2020 Oct 9;8(4):592. doi: 10.3390/vaccines8040592. Vaccines (Basel). 2020. PMID: 33050150 Free PMC article.
-
A Comprehensive Review on Porcine Reproductive and Respiratory Syndrome Virus with Emphasis on Immunity.Vaccines (Basel). 2024 Aug 22;12(8):942. doi: 10.3390/vaccines12080942. Vaccines (Basel). 2024. PMID: 39204065 Free PMC article. Review.
References
-
- Akbari O. DeKruyff RH. Umetsu DT. Pulmonary dendritic cells producing IL-10 mediate tolerance induced by respiratory exposure to antigen. Nat Immunol. 2001;2:725–731. - PubMed
-
- Albina E. Carrat C. Charley B. Interferon-alpha response to swine arterivirus (PoAV), the porcine reproductive and respiratory syndrome virus. J Interferon Cytokine Res. 1998;18:485–490. - PubMed
-
- Atanasova S. Van Gucht S. Barbe F. Lefebvre DJ. Chiers K. Van Reeth K. Lung cell tropism and inflammatory cytokine-profile of porcine respiratory coronavirus infection. Open Vet Sci J. 2008;2:117–126.
Publication types
MeSH terms
Substances
Grants and funding
LinkOut - more resources
Full Text Sources
Other Literature Sources
