

Influence of serum and soluble CD25 (sCD25) on regulatory and effector T-cell function in hepatocellular carcinoma
- PMID: 20883314
- PMCID: PMC2951624
- DOI: 10.1111/j.1365-3083.2010.02427.x
Influence of serum and soluble CD25 (sCD25) on regulatory and effector T-cell function in hepatocellular carcinoma
Abstract
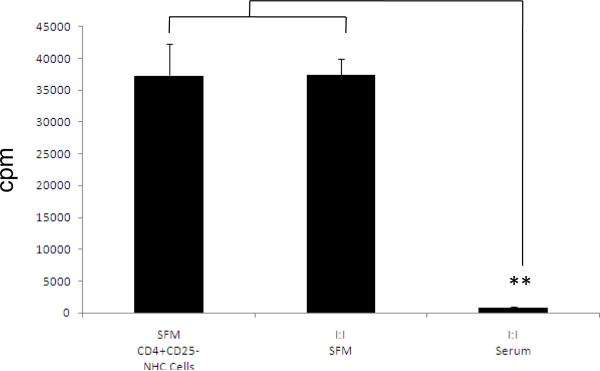
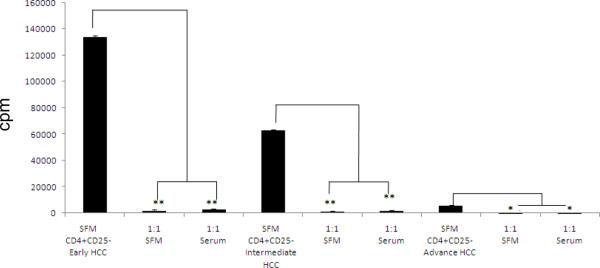
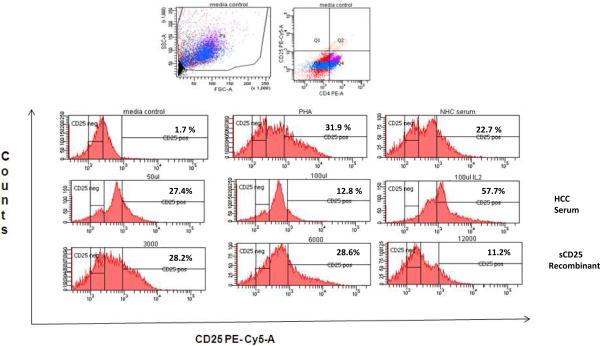
Our previous studies showed that high levels of soluble CD25 (sCD25) in the serum of patients with hepatocellular carcinoma (HCC) correlated with blunted effector T-cells (Teff) responses, tumour burden and poor survival. Understanding the interactions between Teff, CD4+CD25+ regulatory T cells (Treg) and soluble factors can identify novel therapeutic targets. In this study, we characterize the mechanisms by which HCC serum and sCD25 mediate suppression of Teff and evaluate the effect of sCD25 on the suppression assays with normal healthy control cells (NHC) at a 1:1 Treg to Teff cell ratio to determine whether sCD25 has any impact on Treg suppression. HCC serum and sCD25 suppressed Teff proliferation and downregulated CD25 expression on HCC Teff in a dose-dependent fashion with sCD25 doses above 3000 pg/ml. Treg from HCC and cirrhosis patients suppressed proliferation of target CD4+CD25- Teff in serum-free medium (SFM). HCC Treg showed a higher degree of suppression than cirrhosis-derived Treg. In contrast, Treg from NHC did not suppress target Teff in SFM. However, isolated Treg from all three study subjects (HCC, cirrhosis and NHC) suppressed CD4+CD25- Teff in serum conditions or in the presence of sCD25 in the range 6000-12,000 pg/ml. In conclusion, downregulation of CD25 cell surface expression on Teff is part of the overall suppressive mechanism of sCD25 and HCC serum on Teff responses. The observed sCD25 and HCC serum-mediated suppression is further influenced via novel immune-inhibitory interaction between CD4+CD25+ Treg and sCD25.
© 2010 The Authors. Scandinavian Journal of Immunology © 2010 Blackwell Publishing Ltd.
Figures


Similar articles
-
Hepatocellular carcinoma immunopathogenesis: clinical evidence for global T cell defects and an immunomodulatory role for soluble CD25 (sCD25).Dig Dis Sci. 2010 Feb;55(2):484-95. doi: 10.1007/s10620-009-0955-5. Dig Dis Sci. 2010. PMID: 19714465 Free PMC article.
-
Immune modulation of effector CD4+ and regulatory T cell function by sorafenib in patients with hepatocellular carcinoma.Cancer Immunol Immunother. 2013 Apr;62(4):737-46. doi: 10.1007/s00262-012-1380-8. Epub 2012 Dec 7. Cancer Immunol Immunother. 2013. PMID: 23223899 Free PMC article.
-
Influence of membrane CD25 stability on T lymphocyte activity: implications for immunoregulation.PLoS One. 2009 Nov 24;4(11):e7980. doi: 10.1371/journal.pone.0007980. PLoS One. 2009. PMID: 19956753 Free PMC article.
-
Natural Killer Cells and Regulatory T Cells Cross Talk in Hepatocellular Carcinoma: Exploring Therapeutic Options for the Next Decade.Front Immunol. 2021 Apr 30;12:643310. doi: 10.3389/fimmu.2021.643310. eCollection 2021. Front Immunol. 2021. PMID: 33995362 Free PMC article. Review.
-
The role of the adenosinergic pathway in immunosuppression mediated by human regulatory T cells (Treg).Curr Med Chem. 2011;18(34):5217-23. doi: 10.2174/092986711798184334. Curr Med Chem. 2011. PMID: 22087822 Free PMC article. Review.
Cited by
-
Guardian and selective killer: the versatile functions of TLR3 in hepatocellular carcinoma.J Natl Cancer Inst. 2012 Dec 5;104(23):1780-2. doi: 10.1093/jnci/djs475. Epub 2012 Nov 29. J Natl Cancer Inst. 2012. PMID: 23197496 Free PMC article. No abstract available.
-
Neutrophil-lymphocyte ratio predicts overall and recurrence-free survival after liver transplantation for hepatocellular carcinoma.Hepatol Res. 2013 Jul;43(7):757-64. doi: 10.1111/hepr.12019. Epub 2012 Nov 30. Hepatol Res. 2013. PMID: 23193965 Free PMC article.
-
What happens to regulatory T cells in multiple myeloma.Cell Death Discov. 2023 Dec 21;9(1):468. doi: 10.1038/s41420-023-01765-8. Cell Death Discov. 2023. PMID: 38129374 Free PMC article. Review.
-
An RNA Aptamer-Based Biomarker Platform Demonstrates High Soluble CD25 Occupancy by IL2 in the Serum of Follicular Lymphoma Patients.Cancer Immunol Res. 2019 Sep;7(9):1511-1522. doi: 10.1158/2326-6066.CIR-18-0821. Epub 2019 Aug 5. Cancer Immunol Res. 2019. PMID: 31383650 Free PMC article.
-
Biological role of the soluble interleukin-2 receptor in sarcoidosis.Sarcoidosis Vasc Diffuse Lung Dis. 2017;34(2):122-129. doi: 10.36141/svdld.v34i2.5369. Epub 2017 Apr 28. Sarcoidosis Vasc Diffuse Lung Dis. 2017. PMID: 32476833 Free PMC article.
References
-
- Parkin DM, Bray F, Ferlay J, Pisani P. Estimating the world cancer burden: Globocan 2000. Int J Cancer. 2001 Oct 15;94:153–6. - PubMed
-
- Smith KA, Popmihajlov Z. The quantal theory of immunity and the interleukin-2-dependent negative feedback regulation of the immune response. Immunol Rev. 2008 Aug;224:124–40. - PubMed
-
- Cao M, Cabrera R, Xu Y, et al. Hepatocellular carcinoma cell supernatants increase expansion and function of CD4(+)CD25(+) regulatory T cells. Lab Invest. 2007 Jun;87:582–90. - PubMed
-
- Waldmann H, Cobbold S. Regulatory T cells: context matters. Immunity. 2009 May;30:613–5. - PubMed
-
- Foss FM. Immunologic mechanisms of antitumor activity. Semin Oncol. 2002 Jun;29:5–11. - PubMed
Publication types
MeSH terms
Substances
Grants and funding
LinkOut - more resources
Full Text Sources
Other Literature Sources
Medical
Research Materials
