

Simulations of adaptation and color appearance in observers with varying spectral sensitivity
- PMID: 20883345
- PMCID: PMC3056573
- DOI: 10.1111/j.1475-1313.2010.00759.x
Simulations of adaptation and color appearance in observers with varying spectral sensitivity
Abstract
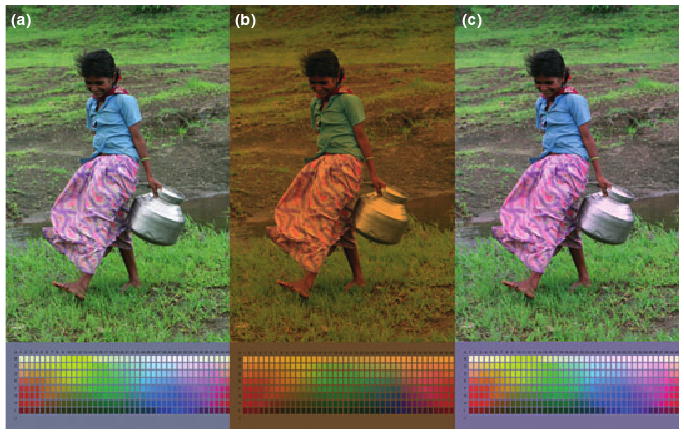
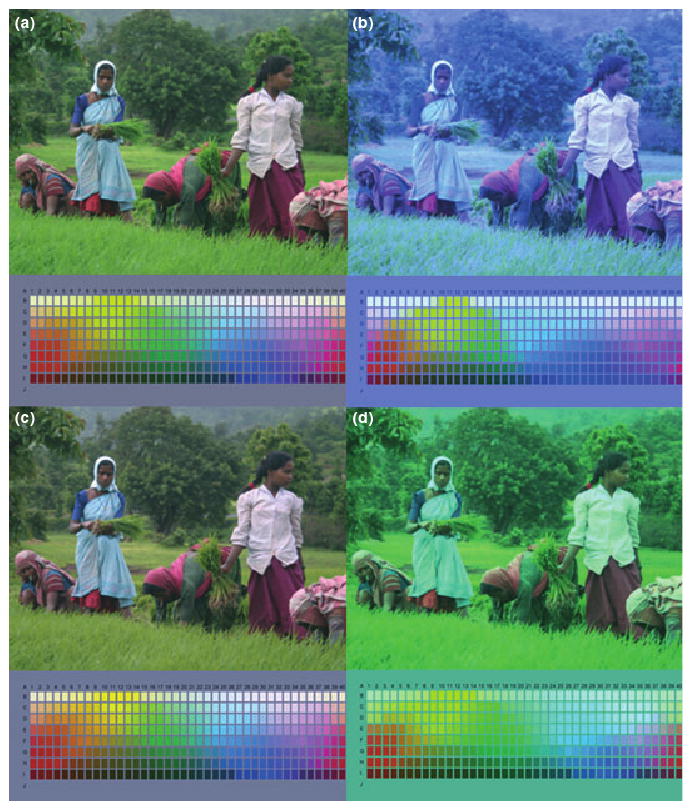
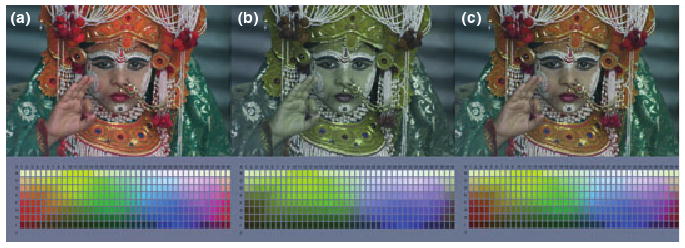
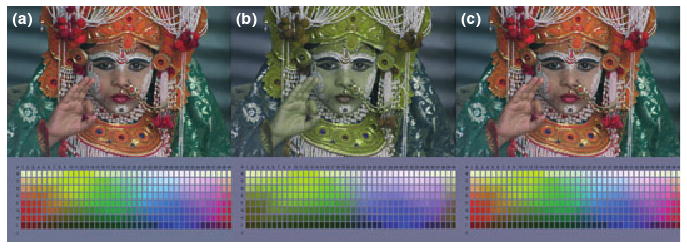
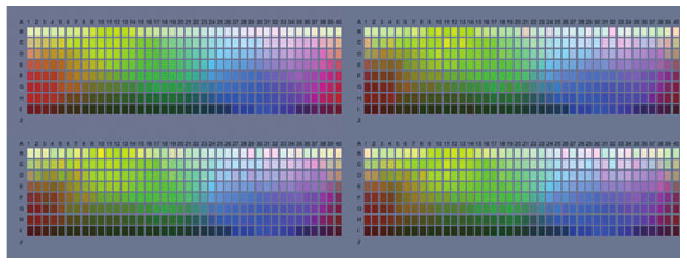
A model of adaptation and visual coding was used to simulate how color appearance might vary among individuals that differ only in their sensitivity to wavelength. Color responses to images were calculated for cone receptors with spectral sensitivities specific to the individual, and in postreceptoral mechanisms tuned to different combinations of the cones. Adaptation was assumed to normalize sensitivity within each cone and postreceptoral channel so that the average response to an ensemble of scenes equaled the mean response in channels defined for the reference observer. Image colors were then rendered from the adapted channels' outputs. The transformed images provide an illustration of the variations in color appearance that could be attributed to differences in spectral sensitivity in otherwise identical observers adapted to identical worlds, and examples of these predictions are shown for both normal variation (e.g. in lens and macular pigment) and color deficiencies (anomalous trichromacy). The simulations highlight the role that known processes of adaptation may play in compensating color appearance for variations in sensitivity both within and across observers, and provide a novel tool for visualizing the perceptual consequences of any variation in visual sensitivity including changes associated with development or disease.
© 2010 The Authors, Ophthalmic and Physiological Optics © 2010 The College of Optometrists.
Figures
Similar articles
-
Color contrast adaptation and compensation in color deficiencies.J Vis. 2025 Aug 1;25(10):17. doi: 10.1167/jov.25.10.17. J Vis. 2025. PMID: 40879282 Free PMC article.
-
Variations in normal color vision. V. Simulations of adaptation to natural color environments.Vis Neurosci. 2009 Jan-Feb;26(1):133-45. doi: 10.1017/S0952523808080942. Epub 2009 Feb 10. Vis Neurosci. 2009. PMID: 19203426 Free PMC article.
-
Compensation for red-green contrast loss in anomalous trichromats.J Vis. 2014 Nov 20;14(13):19. doi: 10.1167/14.13.19. J Vis. 2014. PMID: 25413625 Free PMC article.
-
The Retinal Basis of Vertebrate Color Vision.Annu Rev Vis Sci. 2019 Sep 15;5:177-200. doi: 10.1146/annurev-vision-091718-014926. Epub 2019 Jun 21. Annu Rev Vis Sci. 2019. PMID: 31226010 Review.
-
Guest editorial: Notes on the macular pigment.Ophthalmic Physiol Opt. 2007 Jan;27(1):1-10. doi: 10.1111/j.1475-1313.2006.00452.x. Ophthalmic Physiol Opt. 2007. PMID: 17239185 Review.
Cited by
-
Dynamics of color contrast adaptation.J Opt Soc Am A Opt Image Sci Vis. 2014 Apr 1;31(4):A314-21. doi: 10.1364/JOSAA.31.00A314. J Opt Soc Am A Opt Image Sci Vis. 2014. PMID: 24695188 Free PMC article.
-
Photobiomodulation therapy for congenital color vision deficiency: results of a preliminary randomized clinical trial.Front Med (Lausanne). 2024 Dec 19;11:1497501. doi: 10.3389/fmed.2024.1497501. eCollection 2024. Front Med (Lausanne). 2024. PMID: 39748919 Free PMC article.
-
Adaptation and visual coding.J Vis. 2011 May 20;11(5):10.1167/11.5.3 3. doi: 10.1167/11.5.3. J Vis. 2011. PMID: 21602298 Free PMC article. Review.
-
Task-dependent contrast gain in anomalous trichromats.Vision Res. 2021 Jul;184:14-22. doi: 10.1016/j.visres.2021.02.003. Epub 2021 Mar 25. Vision Res. 2021. PMID: 33773293 Free PMC article.
-
Visualizing Visual Adaptation.J Vis Exp. 2017 Apr 24;(122):54038. doi: 10.3791/54038. J Vis Exp. 2017. PMID: 28518063 Free PMC article.
References
-
- Atick JJ, Li Z, Redlich AN. What does post-adaptation color appearance reveal about cortical color representation? Vision Res. 1993;33:123–129. - PubMed
-
- Barlow HB. A theory about the functional role and synaptic mechanism of visual aftereffects. In: Blakemore C, editor. Visual Coding and Efficiency. Cambridge University Press; Cambridge: 1990. pp. 363–375.
-
- Beer D, Wortman J, Horwitz G, Macleod D. Compensation of white for macular filtering [Abstract] J Vis. 2005;5:282a.
-
- Bosten JM, Robinson JD, Jordan G, Mollon JD. Multidimensional scaling reveals a color dimension unique to ‘color-deficient’ observers. Curr Biol. 2005;15:R950–R952. - PubMed
-
- Brainard DH, Roorda A, Yamauchi Y, Calderone JB, Metha A, Neitz M, Neitz J, Williams DR, Jacobs GH. Functional consequences of the relative numbers of L and M cones. J Opt Soc Am A. 2000;17:607–614. - PubMed
Publication types
MeSH terms
Substances
Grants and funding
LinkOut - more resources
Full Text Sources
