

Arsenic- and cadmium-induced toxicogenomic response in mouse embryos undergoing neurulation
- PMID: 20883709
- PMCID: PMC3014392
- DOI: 10.1016/j.taap.2010.09.018
Arsenic- and cadmium-induced toxicogenomic response in mouse embryos undergoing neurulation
Abstract
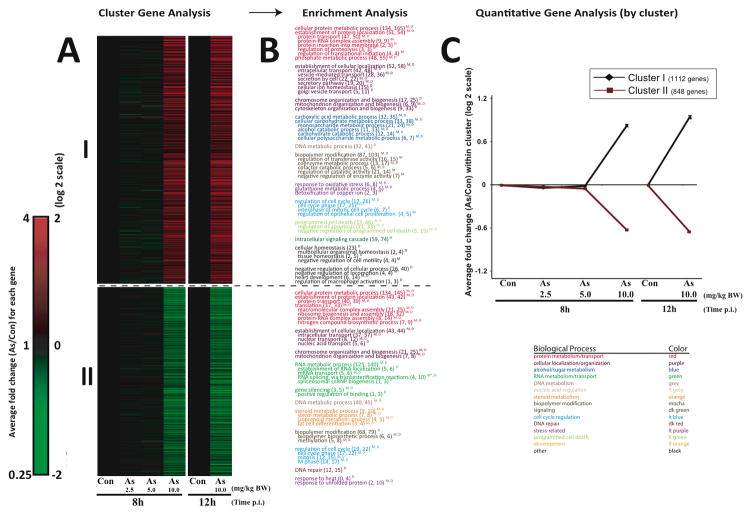
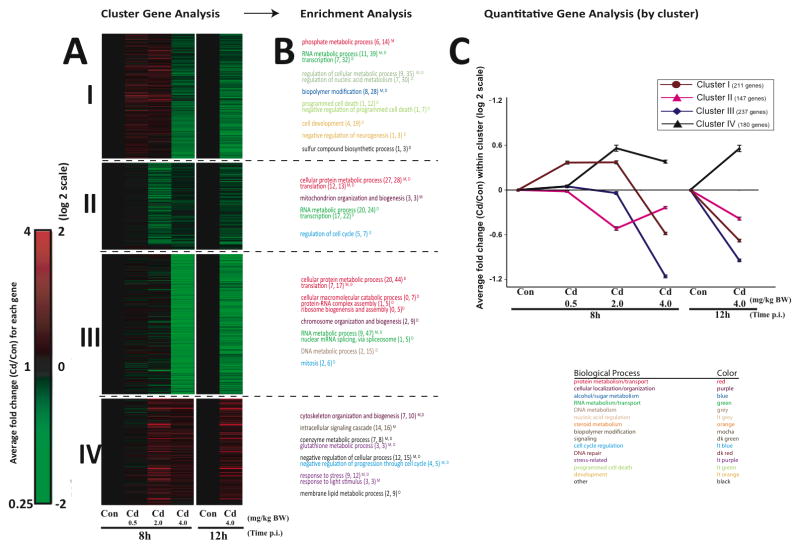
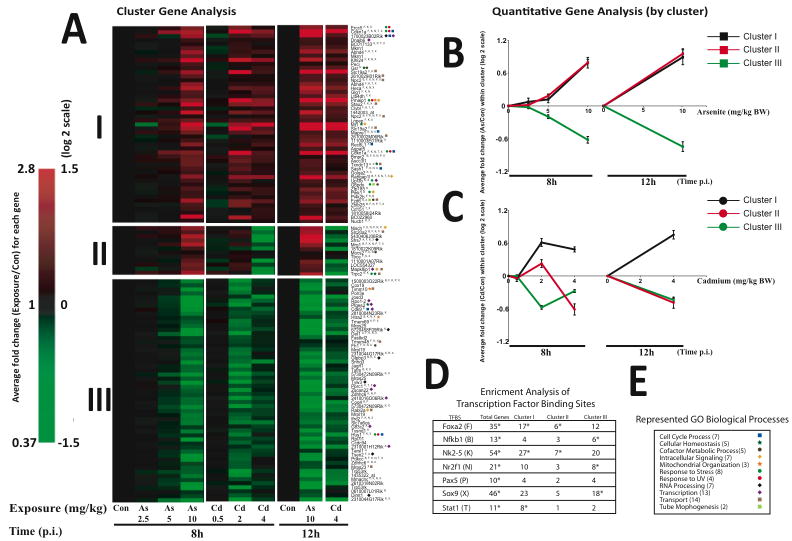
Arsenic (As) and cadmium (Cd) are well-characterized teratogens in animal models inducing embryotoxicity and neural tube defects (NTDs) when exposed during neurulation. Toxicological research is needed to resolve the specific biological processes and associated molecular pathways underlying metal-induced toxicity during this timeframe in gestational development. In this study, we investigated the dose-dependent effects of As and Cd on gene expression in C57BL/6J mouse embryos exposed in utero during neurulation (GD8) to identify significantly altered genes and corresponding biological processes associated with embryotoxicity. We quantitatively examined the toxicogenomic dose-response relationship at the gene level. Our results suggest that As and Cd induce dose-dependent gene expression alterations representing shared (cell cycle, response to UV, glutathione metabolism, RNA processing) and unique (alcohol/sugar metabolism) biological processes, which serve as robust indicators of metal-induced developmental toxicity and indicate underlying embryotoxic effects. Our observations also correlate well with previously identified impacts of As and Cd on specific genes associated with metal-induced toxicity (Cdkn1a, Mt1). In summary, we have identified in a quantitative manner As and Cd induced dose-dependent effects on gene expression in mouse embryos during a peak window of sensitivity to embryotoxicity and NTDs in the sensitive C57BL/6J strain.
© 2010 Elsevier Inc. All rights reserved.
Figures
Similar articles
-
Methylmercury induced toxicogenomic response in C57 and SWV mouse embryos undergoing neural tube closure.Reprod Toxicol. 2010 Sep;30(2):284-91. doi: 10.1016/j.reprotox.2010.05.009. Epub 2010 May 20. Reprod Toxicol. 2010. PMID: 20493249 Free PMC article.
-
Cadmium-induced differential toxicogenomic response in resistant and sensitive mouse strains undergoing neurulation.Toxicol Sci. 2009 Jan;107(1):206-19. doi: 10.1093/toxsci/kfn221. Epub 2008 Oct 29. Toxicol Sci. 2009. PMID: 18974090 Free PMC article.
-
A systems-based approach to investigate dose- and time-dependent methylmercury-induced gene expression response in C57BL/6 mouse embryos undergoing neurulation.Birth Defects Res B Dev Reprod Toxicol. 2010 Jun;89(3):188-200. doi: 10.1002/bdrb.20241. Birth Defects Res B Dev Reprod Toxicol. 2010. PMID: 20540155 Free PMC article.
-
Genetic backgrounds and modifier genes of NTD mouse models: An opportunity for greater understanding of the multifactorial etiology of neural tube defects.Birth Defects Res. 2017 Jan 30;109(2):140-152. doi: 10.1002/bdra.23554. Birth Defects Res. 2017. PMID: 27768235 Review.
-
Mechanics of neurulation: From classical to current perspectives on the physical mechanics that shape, fold, and form the neural tube.Birth Defects Res. 2017 Jan 30;109(2):153-168. doi: 10.1002/bdra.23557. Birth Defects Res. 2017. PMID: 27620928 Free PMC article. Review.
Cited by
-
Parental metal exposures as potential risk factors for spina bifida in Bangladesh.Environ Int. 2021 Dec;157:106800. doi: 10.1016/j.envint.2021.106800. Epub 2021 Aug 3. Environ Int. 2021. PMID: 34358915 Free PMC article.
-
Unraveling the Puzzle: a Systematic Review of the Carcinogenic Role of Arsenic in Head and Neck Cancers.Biol Trace Elem Res. 2025 Jun 10. doi: 10.1007/s12011-025-04697-9. Online ahead of print. Biol Trace Elem Res. 2025. PMID: 40495107 Review.
-
Systems biology and birth defects prevention: blockade of the glucocorticoid receptor prevents arsenic-induced birth defects.Environ Health Perspect. 2013 Mar;121(3):332-8. doi: 10.1289/ehp.1205659. Epub 2013 Jan 3. Environ Health Perspect. 2013. PMID: 23458687 Free PMC article.
-
Does arsenic increase the risk of neural tube defects among a highly exposed population? A new case-control study in Bangladesh.Birth Defects Res. 2017 Jan 30;109(2):92-98. doi: 10.1002/bdra.23577. Birth Defects Res. 2017. PMID: 27801974 Free PMC article.
-
Associations of Heavy Metals with Activities of Daily Living Disability: An Epigenome-Wide View of DNA Methylation and Mediation Analysis.Environ Health Perspect. 2022 Aug;130(8):87009. doi: 10.1289/EHP10602. Epub 2022 Aug 29. Environ Health Perspect. 2022. PMID: 36036794 Free PMC article.
References
-
- Bartke T, Pohl C, Pyrowolakis G, Jentsch S. Dual role of BRUCE as an antiapoptotic IAP and a chimeric E2/E3 ubiquitin ligase. Molecular cell. 2004;14:801–811. - PubMed
-
- Benjamini Y, Hochberg Y. Controlling the false discovery rate: a practical and powerful approach to multiple testing. J Roy Statist Soc Ser B. 1995;57:289–300.
-
- Beyersmann D, Hartwig A. Carcinogenic metal compounds: recent insight into molecular and cellular mechanisms. Archives of toxicology. 2008;82:493–512. - PubMed
-
- Castorena-Torres F, Bermudez de Leon M, Cisneros B, Zapata-Perez O, Salinas JE, Albores A. Changes in gene expression induced by polycyclic aromatic hydrocarbons in the human cell lines HepG2 and A549. Toxicol In Vitro. 2008;22:411–421. - PubMed
-
- Chang XL, Jin TY, Zhou YF. Metallothionein 1 isoform gene expression induced by cadmium in human peripheral blood lymphocytes. Biomed Environ Sci. 2006;19:104–109. - PubMed
Publication types
MeSH terms
Substances
Grants and funding
LinkOut - more resources
Full Text Sources
Research Materials
