

Statistics of natural scenes and cortical color processing
- PMID: 20884516
- PMCID: PMC3193937
- DOI: 10.1167/10.11.21
Statistics of natural scenes and cortical color processing
Abstract
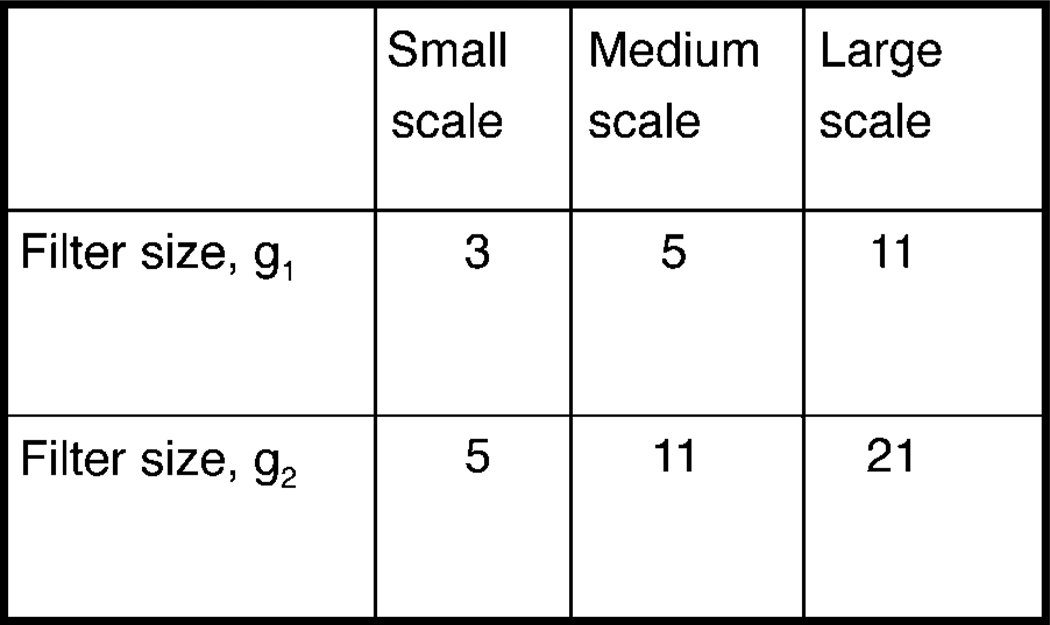
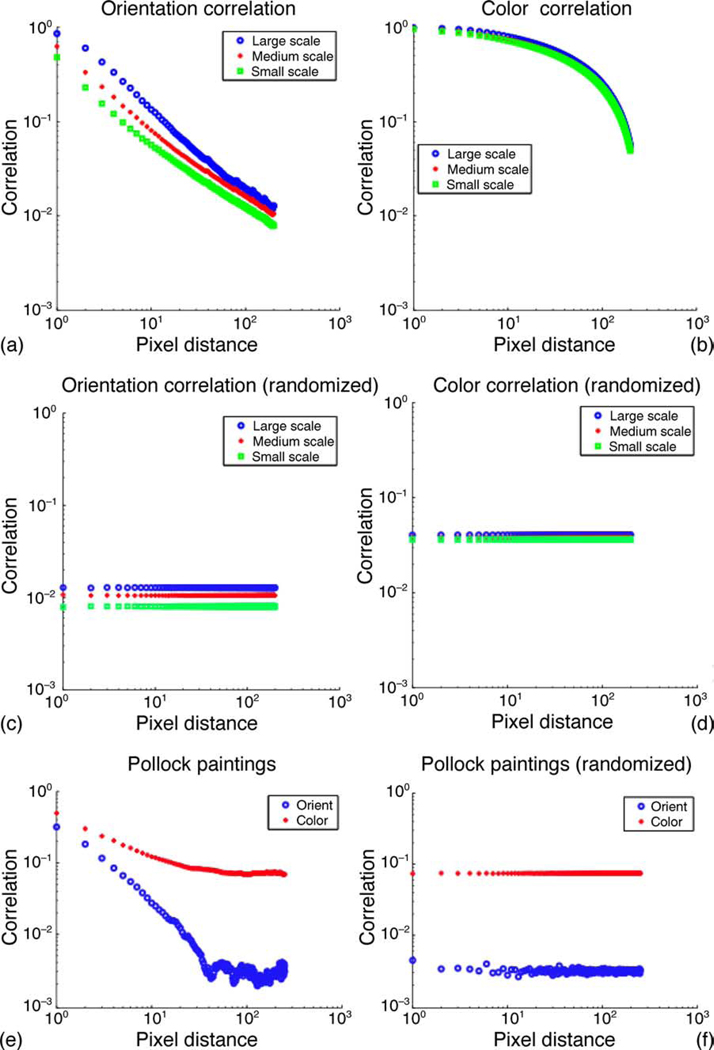
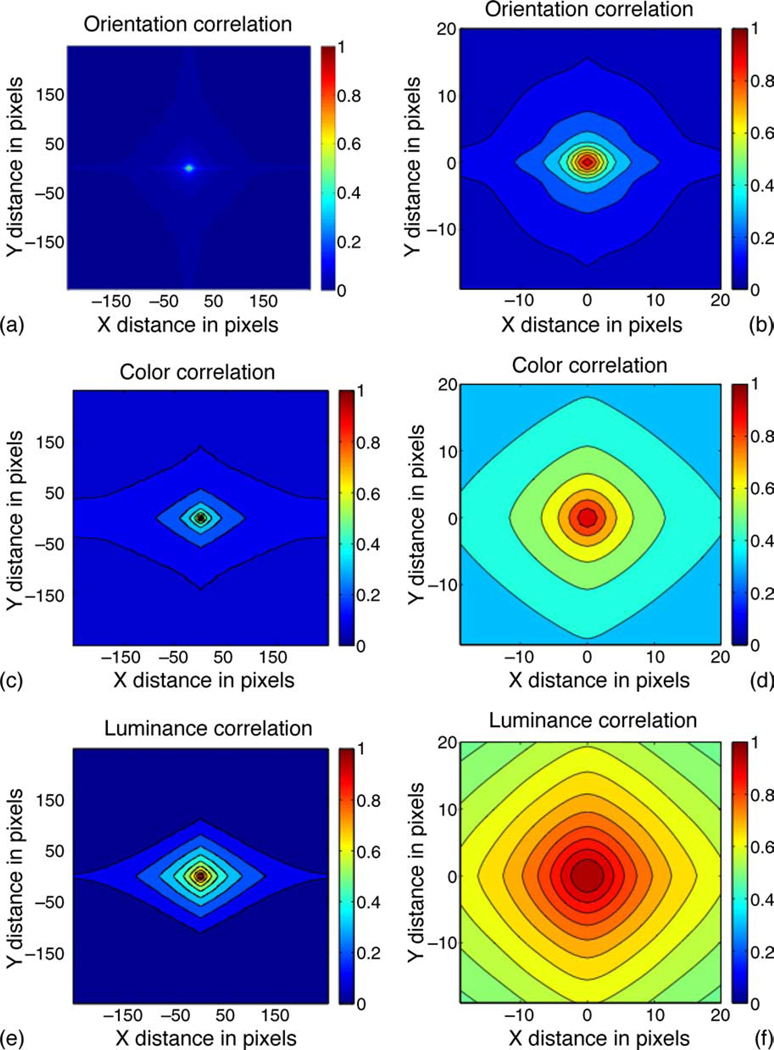
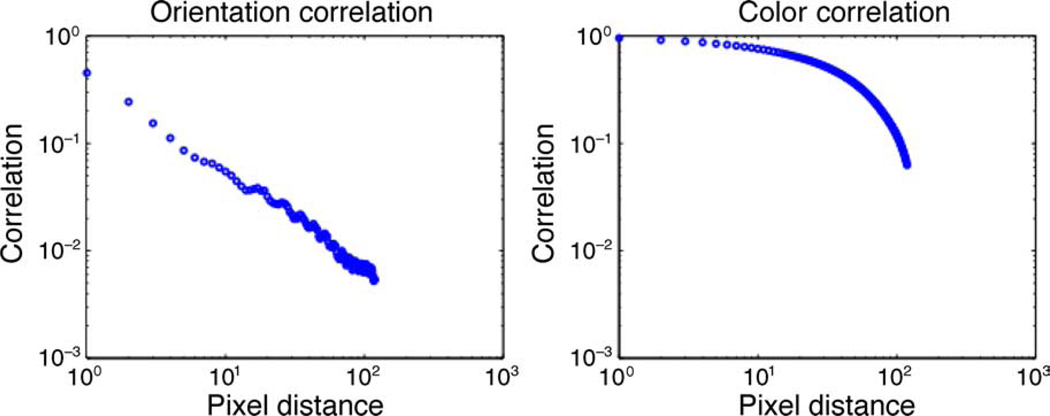
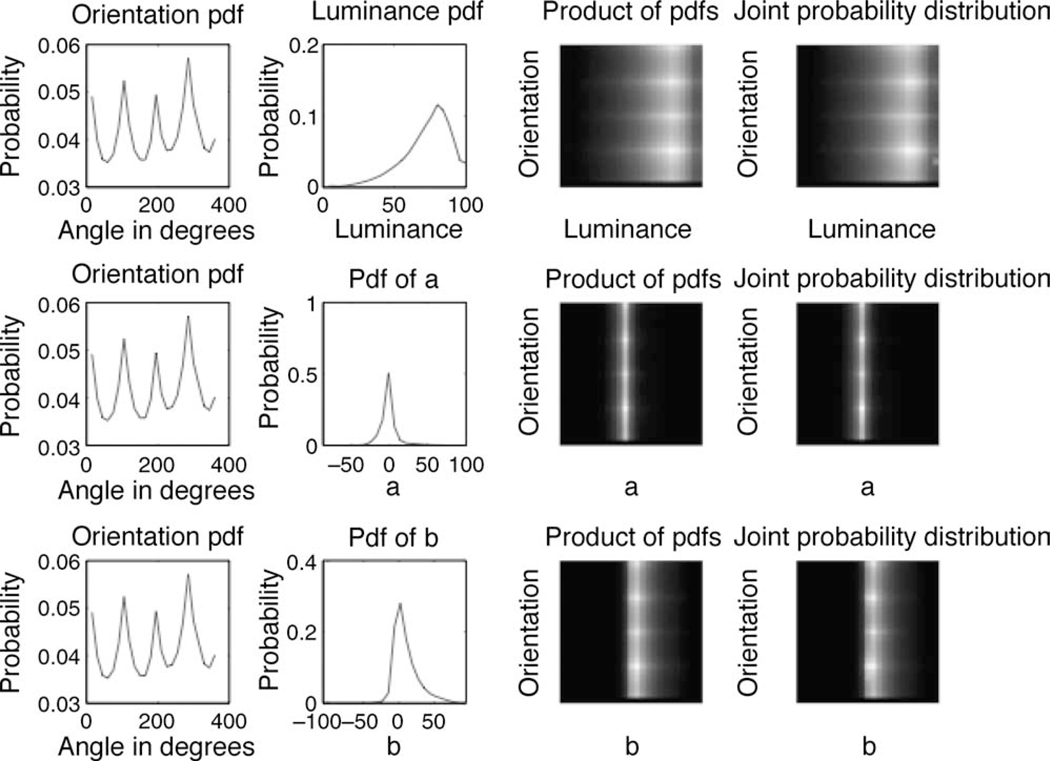
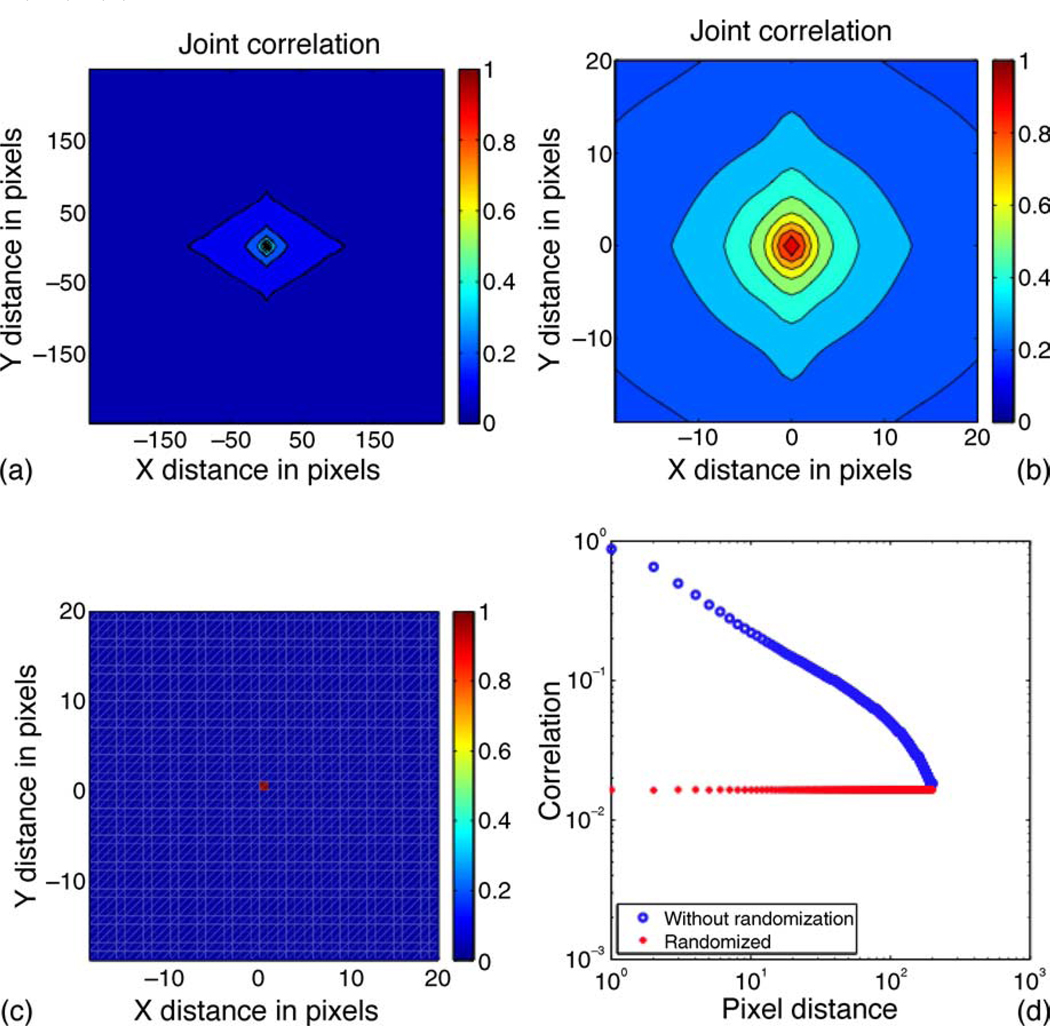
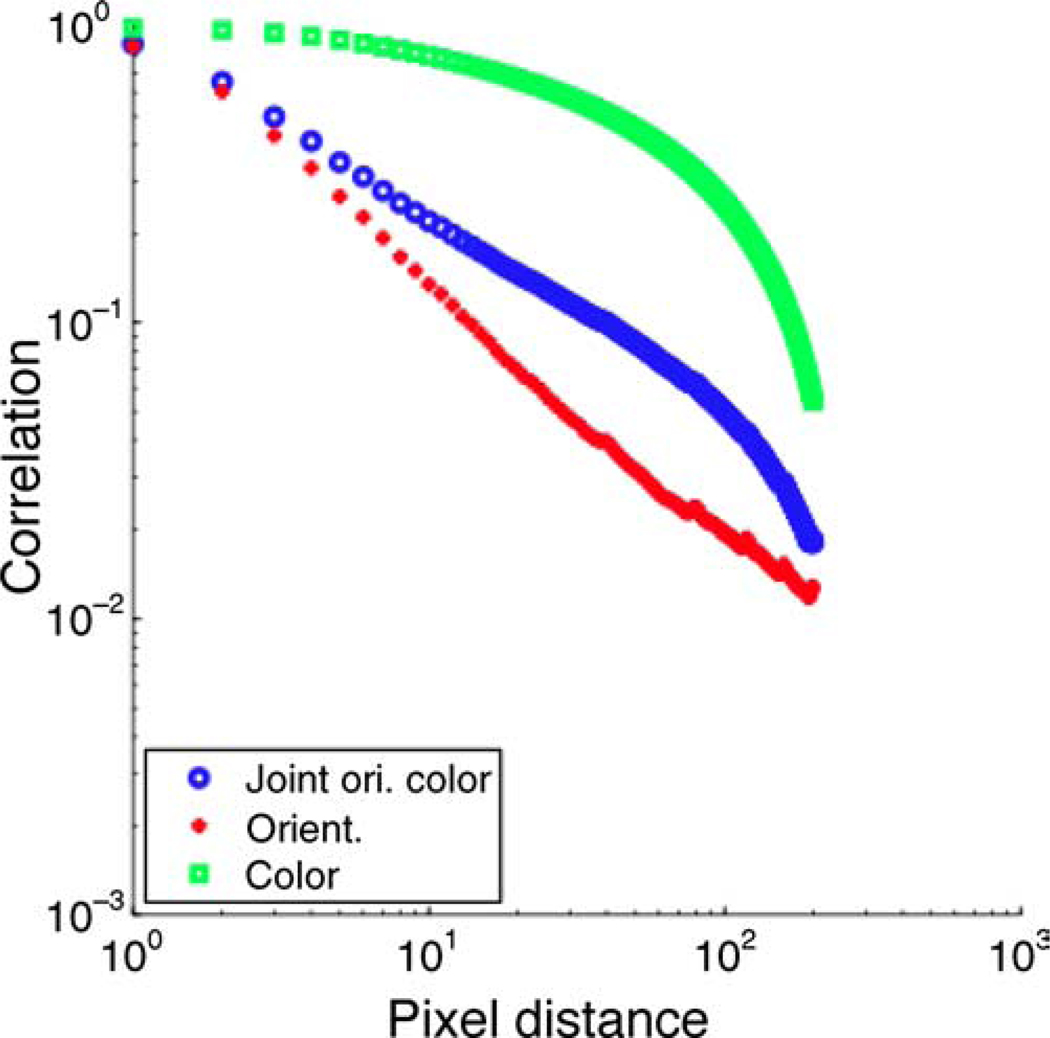
We investigate the spatial correlations of orientation and color information in natural images. We find that the correlation of orientation information falls off rapidly with increasing distance, while color information is more highly correlated over longer distances. We show that orientation and color information are statistically independent in natural images and that the spatial correlation of jointly encoded orientation and color information decays faster than that of color alone. Our findings suggest that: (a) orientation and color information should be processed in separate channels and (b) the organization of cortical color and orientation selectivity at low spatial frequencies is a reflection of the cortical adaptation to the statistical structure of the visual world. These findings are in agreement with biological observations, as form and color are thought to be represented by different classes of neurons in the primary visual cortex, and the receptive fields of color-selective neurons are larger than those of orientation-selective neurons. The agreement between our findings and biological observations supports the ecological theory of perception.
Figures
Similar articles
-
The local and global processing of chromatic Glass patterns.J Vis. 2005 May 13;5(5):405-16. doi: 10.1167/5.5.2. J Vis. 2005. PMID: 16097872
-
Orientation-selective chromatic mechanisms in human visual cortex.J Vis. 2010 Oct 29;10(12):34. doi: 10.1167/10.12.34. J Vis. 2010. PMID: 21047766
-
Independence of color and luminance edges in natural scenes.Vis Neurosci. 2009 Jan-Feb;26(1):35-49. doi: 10.1017/S0952523808080796. Epub 2009 Jan 20. Vis Neurosci. 2009. PMID: 19152717
-
Advances in color science: from retina to behavior.J Neurosci. 2010 Nov 10;30(45):14955-63. doi: 10.1523/JNEUROSCI.4348-10.2010. J Neurosci. 2010. PMID: 21068298 Free PMC article. Review.
-
Functional cell classes and functional architecture in the early visual system of a highly visual rodent.Prog Brain Res. 2005;149:127-45. doi: 10.1016/S0079-6123(05)49010-X. Prog Brain Res. 2005. PMID: 16226581 Review.
Cited by
-
Processing of the S-cone signals in the early visual cortex of primates.Vis Neurosci. 2014 Mar;31(2):189-95. doi: 10.1017/S0952523813000278. Epub 2013 Aug 13. Vis Neurosci. 2014. PMID: 23941664 Free PMC article. Review.
-
Chromatic illumination discrimination ability reveals that human colour constancy is optimised for blue daylight illuminations.PLoS One. 2014 Feb 19;9(2):e87989. doi: 10.1371/journal.pone.0087989. eCollection 2014. PLoS One. 2014. PMID: 24586299 Free PMC article.
-
Electrocorticogram (ECoG) Is Highly Informative in Primate Visual Cortex.J Neurosci. 2020 Mar 18;40(12):2430-2444. doi: 10.1523/JNEUROSCI.1368-19.2020. Epub 2020 Feb 17. J Neurosci. 2020. PMID: 32066581 Free PMC article.
-
Efficient Coding in Visual Working Memory Accounts for Stimulus-Specific Variations in Recall.J Neurosci. 2018 Aug 8;38(32):7132-7142. doi: 10.1523/JNEUROSCI.1018-18.2018. Epub 2018 Jul 13. J Neurosci. 2018. PMID: 30006363 Free PMC article.
-
Mixing of Chromatic and Luminance Retinal Signals in Primate Area V1.Cereb Cortex. 2015 Jul;25(7):1920-37. doi: 10.1093/cercor/bhu002. Epub 2014 Jan 23. Cereb Cortex. 2015. PMID: 24464943 Free PMC article.
References
-
- Atick JJ. Could information theory provide an ecological theory of sensory processing? Network: Computation in Neural Systems. 1992;3:213–251. - PubMed
-
- Atick JJ, Redlich AN. What does the retina know about natural scenes? Neural Computation. 1992;4:196–210.
-
- Barlow HB. Possible principles underlying the transformation of sensory messages. In: Rosenblith WA, editor. Sensory communications. Cambridge, MA: MIT Press; 1961. pp. 217–234.
-
- Ben-Shahar O, Zucker S. Hue geometry and horizontal connections. Neural Networks. 2004;17:743–771. - PubMed
-
- Betsch B, Einhauser W, Kording K, Konig P. The world from a cats perspective—Statistics of natural videos. Biological Cybernetics. 2004;90:41–50. - PubMed
Publication types
MeSH terms
Grants and funding
LinkOut - more resources
Full Text Sources
