. 2010 Nov;104(5):2713-29.
doi: 10.1152/jn.00334.2010. Epub 2010 Sep 8.

Late-expiratory activity: emergence and interactions with the respiratory CpG

Affiliations

Late-expiratory activity: emergence and interactions with the respiratory CpG

Yaroslav I Molkov et al. J Neurophysiol. 2010 Nov.

Abstract

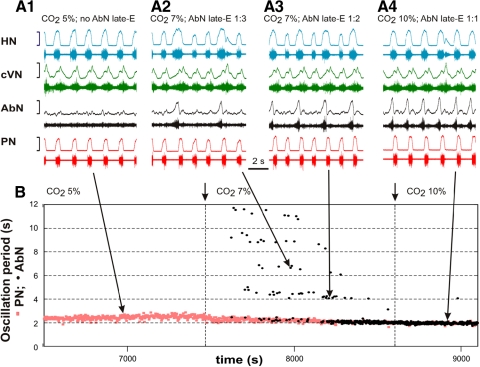
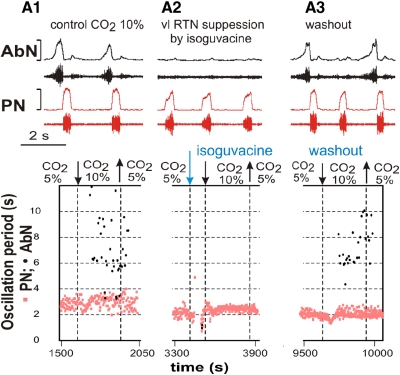
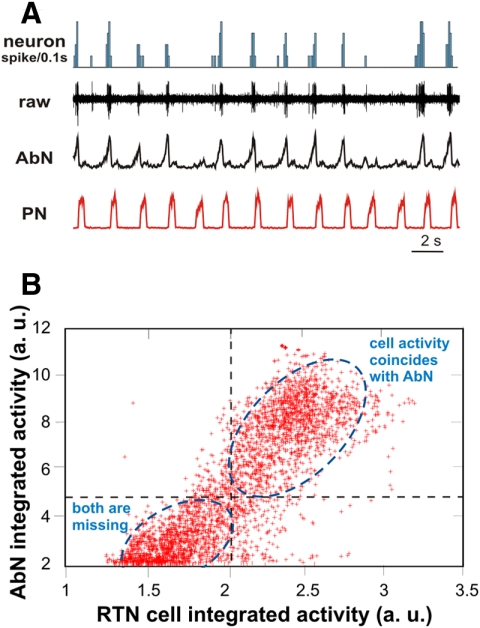
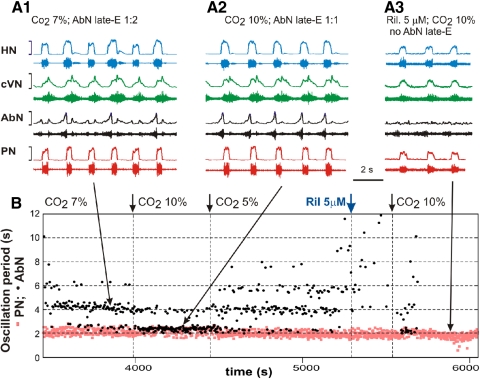
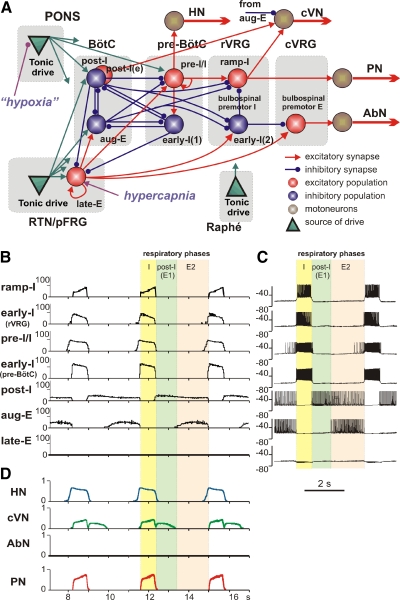
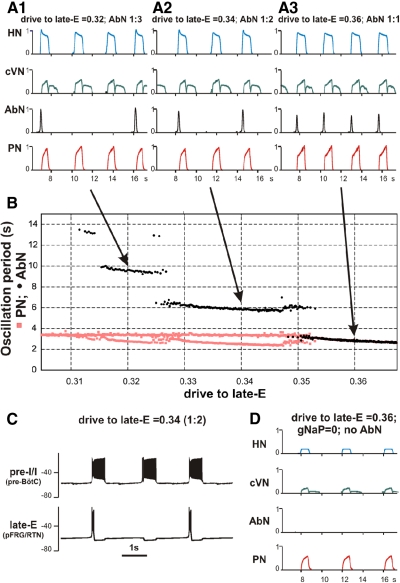
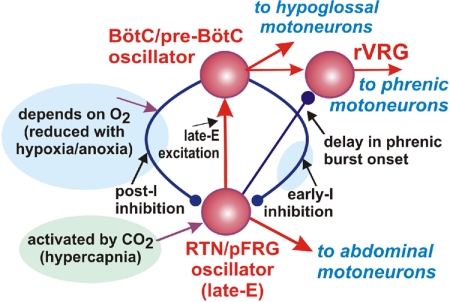
The respiratory rhythm and motor pattern are hypothesized to be generated by a brain stem respiratory network with a rhythmogenic core consisting of neural populations interacting within and between the pre-Bötzinger (pre-BötC) and Bötzinger (BötC) complexes and controlled by drives from other brain stem compartments. Our previous large-scale computational model reproduced the behavior of this network under many different conditions but did not consider neural oscillations that were proposed to emerge within the retrotrapezoid nucleus/parafacial respiratory group (RTN/pFRG) and drive preinspiratory (or late-expiratory, late-E) discharges in the abdominal motor output. Here we extend the analysis of our previously published data and consider new data on the generation of abdominal late-E activity as the basis for extending our computational model. The extended model incorporates an additional late-E population in RTN/pFRG, representing a source of late-E oscillatory activity. In the proposed model, under normal metabolic conditions, this RTN/pFRG oscillator is inhibited by BötC/pre-BötC circuits, and the late-E oscillations can be released by either hypercapnia-evoked activation of RTN/pFRG or by hypoxia-dependent suppression of RTN/pFRG inhibition by BötC/pre-BötC. The proposed interactions between BötC/pre-BötC and RTN/pFRG allow the model to reproduce several experimentally observed behaviors, including quantal acceleration of abdominal late-E oscillations with progressive hypercapnia and quantal slowing of phrenic activity with progressive suppression of pre-BötC excitability, as well as to predict a release of late-E oscillations by disinhibition of RTN/pFRG under normal conditions. The extended model proposes mechanistic explanations for the emergence of RTN/pFRG oscillations and their interaction with the brain stem respiratory network.


Figures

Fig. 1.
Fig. 1.
Quantal acceleration of late-expiratory (late-E) abdominal activity with the development of hypercapnia (increase in the CO2 concentration in the perfusate). A, 1–4: simultaneously recoded activity of (bottom-up) phrenic (PN, red), abdominal (AbN, black), cervical vagus (cVN, green), and hypoglossal (HN, blue) nerves. Activity of each nerve is represented by 2 traces: raw recording (bottom) and integrated activity (top). A1: normocapnia (5% CO2): late-E activity is absent in the AbN. A, 2–4: quantal acceleration of AbN activity: with the development of hypercapnia, the ratio between the AbN and PN frequencies goes through step-wise changes from 1:3 and 1:2 (A, 2 and 3, 7% CO2) to 1:1 (A4, 10% CO2). B: time-series representation of the entire experimental epoch with the oscillation periods in the PN (red squares) and AbN (black circles) plotted continuously versus time. The AbN late-E bursts were synchronized with the PN bursts with a ratio increasing quantally from 1:5 to 1:1. The content of CO2 in the perfusate of this preparation was changed at times indicated by short arrows and vertical dashed lines. Large arrows indicate times corresponding to the episodes shown in A, 1–4.
Fig. 2.
Fig. 2.
The effect of retrotrapezoid nucleus/parafacial respiratory group (RTN/pFRG) suppression on hypercapnia-evoked late-E abdominal activity. The ventrolateral (vl) RTN/pFRG region was inactivated by local bilateral microinjection of isoguvacine, a GABAA receptor agonist. A, 1–3: 3 epochs from the same experiment. In each column, the top diagram shows the raw recording and integrated activity of PN (bottom traces, red) and AbN (top traces, black) nerves, and the bottom diagram shows the changes in the oscillation periods in the PN and AbN with time. In A1, hypercapnia (10% CO2) evoked quantally dispersed late-E bursts in AbN (see nerve recordings at the top and black circles in the bottom diagram). Note that the time interval was not sufficient to allow development of 1:1 ratio of AbN:PN frequencies. In A2, injection of isoguacine fully blocked late-E AbN bursting that would be expected at 10% CO2 (no black circles). In A3, hypercapnia (10% CO2) again evoked late-E discharges in AbN discharge after isoguvacine washout.
Fig. 3.
Fig. 3.
An example of extracellular recording of a single neuron within the vl part of RTN/pFRG during hypercapnia (7% CO2), the activity of which correlated with the abdominal late-E bursts. A: the 2 bottom traces show integrated activities of PN (red) and AbN (black) nerves; the 2nd trace shows raw activity of the RTN/pFRG neuron, and the top trace shows the corresponding spike-frequency histogram of this neuron activity (bin = 0.1 s). Note that the neuronal bursts were skipped whenever AbN bursts were skipped, reflecting their synchrony. B: interdependence between the RTN/pFRG neuron discharges (shown in A) and AbN late-E bursts. Integrated activities of AbN and RTN/pFRG neuron are shown in arbitrary units (a. u.) during a 300 s epoch with sampling frequency of 100 Hz (30,000 points in total) and plotted against each other (red crosses). Dashed lines representing thresholds split the space into 4 quadrants. The top right quadrant represents cases where both cell activity and AbN late-E bursts were present (indicated by blue dashed ellipse); the bottom left quadrant represents cases where both cell and AbN late-E discharges were missing (indicated by another blue dashed ellipse) and only background activity is represented.
Fig. 4.
Fig. 4.
Effect of riluzole on the hypercapnia-induced AbN late-E activity. A, 1–3: simultaneously recoded activity of (bottom-up) PN (red), AbN (black), cVN (green), and HN (blue) nerves. B: representation of the entire experimental epoch by plotting the oscillation periods in PN (red squares) and AbN (black circles) vs. time. A, 1 and 2, and the corresponding parts of the diagram in B (indicated by large arrows) show quantal acceleration of the AbN late-E activity with the development of hypercapnia from 7% CO2 (see in B, left, and A1 showing a 1:2 ratio between AbN and PN frequencies) to 10% CO2 (see in B after 1st small arrow indicating changing CO2 to 10% and in A2 where the ratio of frequencies is 1:1). The level of CO2 then was returned back to 5% (see 2nd small arrow in B) and the frequency of AbN started quantally reducing. Then riluzole (5 μM), the persistent sodium current blocker, was added to the pefusate (indicated in B by blue arrow). The right arrow in B indicates the moment when CO2 was increased to 10% in the presence of riluzole. A3 and B, right, shows that riluzole abolished the hypercapnia-evoked AbN late-E activity while only reducing the amplitude (and frequency) of discharges in other nerves.
Fig. 5.
Fig. 5.
Effect of late-E activity on the temporal relationships between PN and HN bursts. A: integrated activities of PN (bottom trace, red), AbN (middle trace, black), and HN (top trace, blue) nerves during hypercapnic (7% CO2) regime corresponding to a 1:3 ratio between AbN and PN frequencies. The delay between onsets of PN and HN bursts is substantially longer when late-E bursts are present in AbN than when they are missing (shown by dashed vertical lines). The earlier onset of HN discharges coincides with AbN late-E bursts and the delayed onset of PN bursts coincides with the termination AbN late-E discharges. B: the delays between onsets of HN and PN bursts are indicated by small red pluses in the presence of AbN activity and by small blue crosses in the absence of AbN bursts. The corresponding histograms show the distributions of delays between HN and PN onsets for the 2 cases, when AbN bursts are present (red) and when they are missed (blue).
Fig. 6.
Fig. 6.
Transformation of the pattern of abdominal activity from late-E (pre-I) bursting to biphasic-E discharge during hypercapnic anoxia (7% CO2, 93% N2). The top 3 traces show integrated activity of cVN, AbN, and PN nerves. The bottom trace represents the index of postinspiratory (post-I) activity calculated as an averaged activity in cVN during the expiratory phase in each cycle (shown as the gray area in the cVN trace); the expiratory phase was defined by the PN trace (vertical dashed line indicates the onset of expiration). In the 1st half of the recorded episode, only late-E bursts were present in AbN. The post-I component of cVN was progressively reducing. The transition of AbN bursts to a biphasic-E discharge pattern (with pre-I and post-I components) occurred after a significant suppression of the cVN post-I activity (indicated by vertical and horizontal dash-dotted lines).
Fig. 7.
Fig. 7.
The extended model of the brain stem respiratory network. A: schematic of the extended model showing interactions between different populations of respiratory neurons within major brain stem compartments involved in the control of breathing (pons, RTN/pFRG, BötC, pre-BötC, rVRG, and cVRG). Each population (shown as a sphere) consists of 50 single-compartment neurons described in the Hodgkin-Huxley style. In comparison with the previous model (Smith et al. 2007), this model additionally incorporates the population of bulbospinal premotor expiratory (E) neurons in cVRG, representing the source of AbN activity, and the late-E population in the RTN/pFRG compartment (see text for details), serving as a source of RTN/pFRG oscillations. Justification for all interconnections used in the basic models can be found (with the corresponding references) in our previous papers (Rubin et al. 2009; Rybak et al. 2007; Smith et al. 2007). Justification of interconnections involving the late-E population is in the text. The model includes 3 sources of tonic excitatory drive: pons, RTN, and raphé—all shown as green triangles. These drives, especially those from the pontine and RTN sources project to multiple neural populations in the model (green arrows). However, to simplify the schematic, only the most important connections are shown connected to particular populations. The full structure of connections from each drive source [drive(pons); drive(RTN); drive(raphé)] to target neural populations of the model and the corresponding synaptic weights can be found in Table 1. The late-E population receives an additional external drive simulating the effect of hypercapnia; the pontine drive is considered to be hypoxia/anoxia dependent and was reduced in simulation of hypoxic conditions. B: model performance under normal conditions. The activity of major neural populations in the model are represented by average histograms of activity of all neurons in each population (bin = 30 ms). The shown populations include (top-down): ramp-inspiratory (ramp-I located in rVRG), early-inspiratory [early-I(2) in rVRG], preinspiratory/inspiratory (pre-I/I in pre-BötC), early-inspiratory [early-I(1) in pre-BötC], postinspiratory (post-I in BötC), augmenting expiratory (aug-E in BötC), and late-expiratory (late-E in RTN/pFRG). The latter population is silent under normal conditions. C: traces of membrane potentials of the corresponding single neurons (randomly selected from each population). D: the dynamics of the model's motor outputs: HN (blue); cVN (green); AbN (black, silent under normal conditions); PN (red). In B–D, the 3 phase of respiratory cycle are highlighted: inspiratory (I, yellow), postinspiratory (post-I or E1, light green), second expiratory (E2, pink). It is seen that pre-I/I neurons and HN start firing in advance of the beginning of inspiration defined by the onset of PN (and the ramp-I population).
Fig. 8.
Fig. 8.
Modeling the effects of progressive hypercapnia and INaP blockade. A, 1–3: the activity of motor outputs in the model during simulated hypercapnia. The late-E bursts in the AbN were always phase-locked with PN bursts and the ratio between AbN and PN frequencies quantally increased through 1:3 (A1) to 1:2 (A2) and to 1:1 (A3) as “hypercapnic” drive to the late-E population of RTN/pFRG gradually increased to simulate progressive hypercapnia. B: the dependence of oscillation periods in AbN (black circles) and PN (red squares) on the hypercapnic drive (horizontal axis). This simulation shows a quantal acceleration of AbN activity during a gradual increase in the simulated hypercapnic drive. The ratio between AbN and PN frequencies sequentially jumped from 1:4 to 1:3 (as in A1), then to 1:2 (as in A2), and finally to 1:1 (as in A3). See Fig. 1 for comparison. With quantal acceleration of AbN activity (after it emerges at 0.31 and before it reaches 1:1 ratio at 0.35) PN periods alternate between 2 red branches depending on the presence or absence of an AbN burst during corresponding breathing cycle. C: membrane potential traces of single neurons from the pre-I/I population of pre-BötC (bottom trace) and the late-E population of RTN/pFRG (top trace) corresponding to the regime of 1:2 coupling between AbN and PN bursts (A2). D: simulation of the effect of INaP blockade. Model output motor activities shown correspond to the regime of 1:1 coupling shown in A3. The blockade of INaP was simulated by setting its maximal conductance to 0 in all neurons of the model. This led to a full suppression of AbN activity and a reduction in amplitude and frequency of other simulated motor outputs (compare with Fig. 4A3).
Fig. 9.
Fig. 9.
The effect of late-E activity on the delay between onsets of HN and PN bursts in the model. Three motor outputs of the model are shown (HN, blue; AbN, black; and PN, red) during the hypercapnic regime corresponding to 1:2 ratio between AbN and PN frequencies. The late-E bursts when present increased the delay between onsets of the corresponding HN and PN bursts (indicated by gray bars).
Fig. 10.
Fig. 10.
Transformation of the late-E to a biphasic-E activity with the development of simulated hypoxia. A: in this simulation, the value of drive to the late-E population was set to 0.36 to produce 1:1 coupling between the late-E and PN activities (see Fig. 8A3). A gradual reduction of pontine drive (bottom trace) was used to produce a progressive reduction of post-I activity during development of hypoxia/anoxia (see cVN trace). During this reduction of pontine drive, the AbN pattern sequentially transformed from late-E (pre-I) bursting (see 0–40 s) to a rebound post-I type bursting pattern (40–70 s) and then to a biphasic-E pattern (with pre-I and post-I components (70–100 s). B–D: membrane potential traces of single neurons from the pre-I/I population of pre-BötC (bottom traces) and the late-E population of RTN/pFRG (top traces) corresponding to the AbN late-E (pre-I) pattern (B), post-I pattern (C) and the biphasic-E pattern (D), indicated by arrows.
Fig. 11.
Fig. 11.
Simulation of quantal slowing of PN activity. A: to simulate quantal slowing of PN activity, we 1st set the value of drive to late-E to 0.36 and the value of pontine drive to 0. This regime corresponded to the end of the simulation shown in Fig. 10 with a biphasic-E pattern of AbN activity. Then the excitability of the pre-BötC neurons [in both the pre-I/I and early-I(1) populations] was linearly decreased by a proportional reduction of all weights of excitatory synapses to pre-I/I and early-I(1) neurons (“pre-BötC suppression,” see lower trace, starting with 78% of the basic value and reducing this to 0). During progressive reduction of pre-BötC neuronal excitability, the frequency of PN (and HN and cVN) bursts was quantally reduced with the ratio to AbN frequency jumping from 1:1 to 1:2 and so on (see red steps in B) until the activity of all nerves except AbN was abolished. B: this diagram demonstrates a step-wise dependence of AbN (black circles) and PN (red squares) periods on the pre-BötC's synaptic depression. After the 1st step in PN period (around 75% of normal synaptic weights), 2 different periods of AbN activity were observed. The longer periods correspond to AbN cycles accompanied by PN bursts and the shorter periods correspond to AbN oscillations with PN silent. C: membrane potential traces of single neurons from the pre-I/I population of pre-BötC (bottom traces) and the late-E population of RTN/pFRG (top traces), corresponding to the regime 4:1. Note that the profile of AbN bursts in A and late-E bursts in C changed from the biphasic-E activity to a monophasic burst whenever the PN bursts were missing.
Fig. 12.
Fig. 12.
Release of the AbN late-E busting under normal conditions by suppressing inhibition in RTN/pFRG. A: simulation results. The traces of motor outputs PN, AbN and HN generated by the model are shown. Drive to late-E was set to 0.3, below the threshold for late-E population activation (see Fig. 8B). To simulate the blockade of inhibition within RTN/pFRG, the weights of inhibitory synapses in late-E neurons were set to 0 during the time interval between 10 and 17.5 s (indicated by gray area). Removing inhibition evoked late-E oscillations in both the late-E population in the RTN/pFRG (not shown) and in the model's AbN output. The bursts generated were phase-locked to PN oscillations. After inhibition returned to the previous level (at 17.5 s), AbN activity disappears. B and C: experimental testing of the preceding modeling prediction. The experiment shown was performed at normal metabolic conditions with 5% CO2 in the perfusate. Under control conditions, there was no late-E bursting activity in AbN (see AbN activity in B, left, and a lack of black circles in C under “control”). Bicuculline (10 μM), a blocker of GABAA inhibition, was bilaterally microinjected in vl RTN/pFRG at the moment shown in B by the vertical dashed line. As seen in B (middle) and C (black circles), the application of bicuculline evoked rhythmic late-E activity in AbN phase-locked with PN bursts. The AbN activity evoked by disinhibition then disappeared with the drug washout (see B, right, and lack of black circles in C, right).
Fig. 13.
Fig. 13.
Proposed interactions between BötC/pre-BötC and RTN/pFRG oscillators in adult mammals in vivo. Red arrows represent excitatory influence; blue lines terminated with circles indicate inhibitory influence; violet arrows indicate metabolic dependence. Under normal metabolic conditions, the RTN/pFRG oscillator is inhibited by the BötC/pre-BötC oscillator (the core of the respiratory CPG) during both inspiration (by the inhibitory early-I neurons of pre-BötC) and expiration (by the post-I neurons of BötC) and remains silent. The normal expression of post-I inhibition requires excitatory drive from the pons (not shown). The RTN/pFRG oscillator can be activated either by hypercapnia, which directly excites RTN/pFRG neurons, or by hypoxia/anoxia (or pontine suppression), which reduces RTN/pFRG inhibition by the BötC/pre-BötC oscillator, or by both. When activated, the RTN/pFRG oscillator provides both excitation of the BötC/pre-BötC oscillator and inhibition of rVRG premotor neurons, hence increasing the delay between hypoglossal and phrenic discharges.

Similar articles

Cited by

References

    1. Abdala AP, Rybak IA, Smith JC, Paton JF. Abdominal expiratory activity in the rat brain stem-spinal cord in situ: patterns, origins and implications for respiratory rhythm generation. J Physiol 587: 3539–3559, 2009a - PMC - PubMed
    1. Abdala AP, Rybak IA, Smith JC, Zoccal DB, Machado BH, St-John WM, Paton JF. Multiple pontomedullary mechanisms of respiratory rhythmogenesis. Respir Physiol Neurobiol 168: 19–25, 2009b - PMC - PubMed
    1. Abu-Shaweesh JM, Dreshaj IA, Thomas AJ, Haxhiu MA, Strohl KP, Martin RJ. Changes in respiratory timing induced by hypercapnia in maturing rats. J Appl Physiol 87: 484–490, 1999 - PubMed
    1. Baker SN, Kilner JM, Pinches EM, Lemon RN. The role of synchrony and oscillations in the motor output. Exp Brain Res 128: 109–117, 1999 - PubMed
    1. Ballanyi K, Onimaru H, Homma I. Respiratory network function in the isolated brainstem-spinal cord of newborn rats. Prog Neurobiol 59: 583–634, 1999 - PubMed

Publication types

LinkOut - more resources