. 2010 Oct;177(4):2080-90.
doi: 10.2353/ajpath.2010.100104.

Constant p53 pathway inactivation in a large series of soft tissue sarcomas with complex genetics

Affiliations

Constant p53 pathway inactivation in a large series of soft tissue sarcomas with complex genetics

Gaëlle Pérot et al. Am J Pathol. 2010 Oct.

Abstract

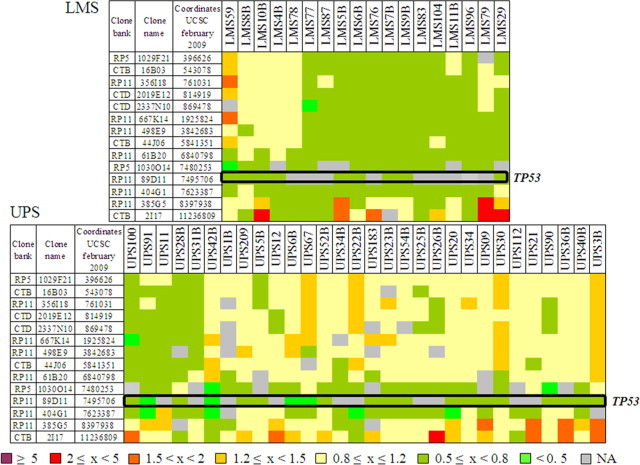
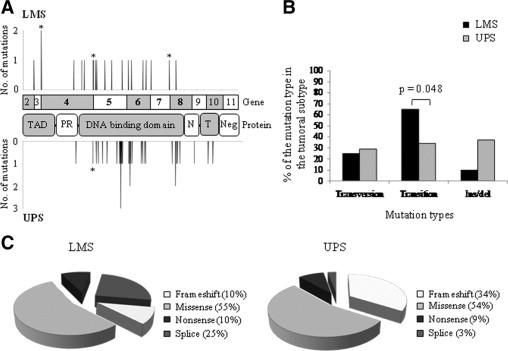
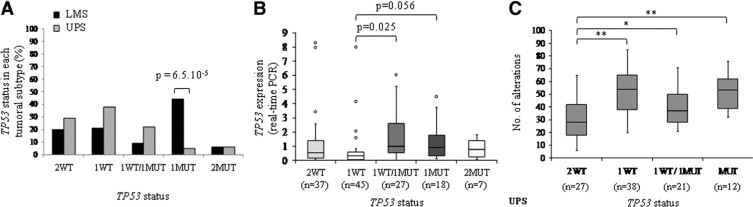
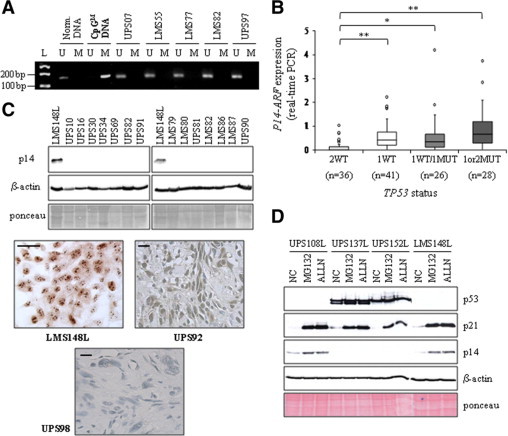
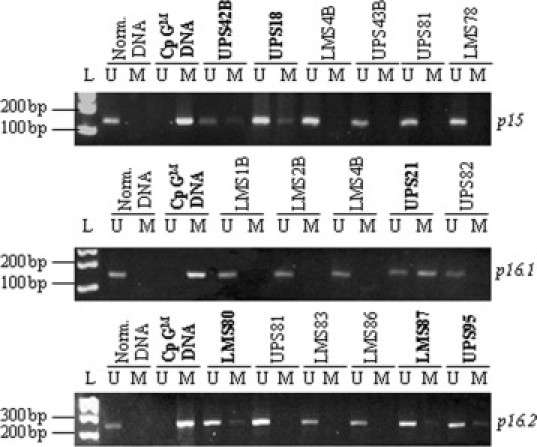
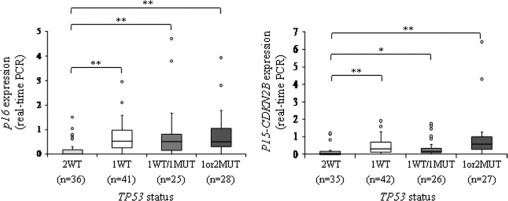
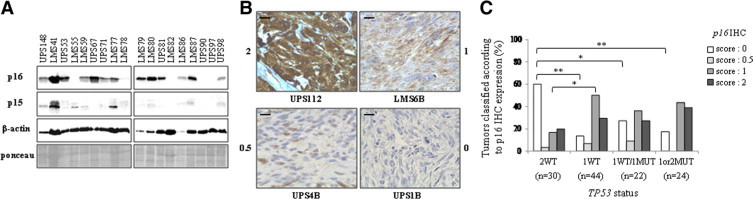
Alterations of the p53 pathway are among the most frequent aberrations observed in human cancers. We have performed an exhaustive analysis of TP53, p14, p15, and p16 status in a large series of 143 soft tissue sarcomas, rare tumors accounting for around 1% of all adult cancers, with complex genetics. For this purpose, we performed genomic studies, combining sequencing, copy number assessment, and expression analyses. TP53 mutations and deletions are more frequent in leiomyosarcomas than in undifferentiated pleomorphic sarcomas. Moreover, 50% of leiomyosarcomas present TP53 biallelic inactivation, whereas most undifferentiated pleomorphic sarcomas retain one wild-type TP53 allele (87.2%). The spectrum of mutations between these two groups of sarcomas is different, particularly with a higher rate of complex mutations in undifferentiated pleomorphic sarcomas. Most tumors without TP53 alteration exhibit a deletion of p14 and/or lack of mRNA expression, suggesting that p14 loss could be an alternative genotype for direct TP53 inactivation. Nevertheless, the fact that even in tumors altered for TP53, we could not detect p14 protein suggests that other p14 functions, independent of p53, could be implicated in sarcoma oncogenesis. In addition, both p15 and p16 are frequently codeleted or transcriptionally co-inhibited with p14, essentially in tumors with two wild-type TP53 alleles. Conversely, in TP53-altered tumors, p15 and p16 are well expressed, a feature not incompatible with an oncogenic process.


Figures

Figure 1
Figure 1
TP53 gene deletions in sarcomas. Array-CGH results on 14 BAC-PAC clones covering the first part of 17p chromosome. Names of these clones and their genomic locations are indicated on the left. Names of studied tumors are indicated at the top. The first graph represents data for LMS and the second one shows those for UPS. Tumoral DNA/normal DNA ratios greater than 2 were considered as amplifications, ratios greater than 1.2 and less than 0.8 were considered gains and losses, respectively. The genomic status (ratio) of each tumor for each locus is indicated by a color code in filled squares, as defined at the bottom. Position of TP53 gene is indicated (open black box).
Figure 2
Figure 2
TP53 mutations identified in LMS and UPS. A: Distribution of the identified TP53 mutations along the coding and protein sequences in LMS (top) and UPS (bottom). Asterisks correspond to mutations at splicing sites. TAD, transactivation domain; PR, proline-rich domain; N, NLS sequence; T, tetramerization domain; and Neg, negative regulation domain. Exons 4 to 8 were studied by functional analysis of separated alleles in yeast. B: Comparison of the different types of mutations between LMS and UPS. Significant Fisher's exact test P value is indicated over brackets. C: Pie charts representing the different mutation types in LMS and in UPS.
Figure 3
Figure 3
TP53 alleles status in tumors. A: Percentage of tumors with a particular TP53 gene status. 2WT, tumors with two wild-type copies of TP53; 1WT, tumors with one WT copy and a deletion of the other one; 1WT/1MUT, tumors with one WT allele and one mutated allele; 1MUT, tumors with one mutated allele and a deletion of the other one; and 2 MUT, tumors with 2 mutated alleles. Significant Fisher's exact test P value is indicated over brackets. B: Boxplot analysis of TP53 expression in the different groups defined according to TP53 alleles status (real-time PCR). Results for LMS and UPS were similar and thus grouped together. Student's t-test P value is indicated over brackets. C: Boxplot analysis of the alterations number in UPS classified according to their TP53 alleles status. Number of alterations was evaluated according to array-CGH data by the VAMP interface (http://bioinfo.curie.fr/vamp). Only UPS data are presented because the LMS series was too small to be really statistically informative. *P < 0.05; **P < 0.01 (Student's t-test) (2WT vs 1WT: P = 1.2.10−6; 2WT vs. 1WT/1MUT: P = 1.4.10−2; 2WT vs. 1or2MUT: P = 2.4.10−3).
Figure 4
Figure 4
p14 expression in sarcomas. A: Some tumor methylation profiles of the p14 promoter are presented as examples. M: methylated-specific PCR, U: unmethylated-specific PCR. Normal DNA and CpGenome Universal Methylated DNA (CpGM DNA) are used as controls. L, molecular weight ladder. B: Boxplot analysis of p14 expression (real-time PCR). *P < 0.05; **P < 0.01 (Student's t-test) (2WT vs. 1WT: P = 5.7.10−5; 2WT vs. 1WT/1MUT: P = 2.10−2; 2WT vs. 1or2MUT: P = 1.5.10−4). Data for the two tumor types have been grouped because of the similarity of their results. C: Representative p14 Western blot. β-actin and Ponceau staining are shown as loading controls. Examples of p14 immunohisto/cytolabeling are presented. Scale bar = 40 μm. D: p14 Western blot performed after 8 hours of MG132 or ALLN treatment of four sarcoma cell lines. NC: negative control, cell lines cultured in medium with dimethyl sulfoxide. Features of these cell lines are similar to those of the corresponding tumors and are described in the Supplemental Table S4, at http://ajp.amjpathol.org. p21 and p53 are used to see the efficiency of the inhibitors. Ponceau staining and β-actin, loading controls.
Figure 5
Figure 5
p16 and p15 promoter CpG islands methylation profiles. Some tumor methylation profiles of p16 and p15 promoters are presented. For p16, two regions of methylation sites have been studied (p16.1 and p16.2). Tumors with methylated CpG islands are illustrated in bold characters. L, molecular weight ladder.
Figure 6
Figure 6
p16 and p15 RNA expression in sarcomas. Boxplot analysis of p16 and p15 expressions (real-time PCR): *P < 0.05; **P < 0.01 (Student's t-test) (for p16: 2WT vs. 1WT: P = 7.6.10−5; 2WT vs. 1WT/1MUT: P = 2.10−2; 2WT vs. 1or2MUT: P = 10−3) (for p15: 2WT vs. 1WT: P = 2.10−3; 2WT vs. 1WT/1MUT: P = 4.7.10−2; 2WT vs. 1or2MUT: P = 10−2). Data for the two tumor types have been grouped because of the similarity of their results.
Figure 7
Figure 7
p16 and p15 protein expression in sarcomas. A: Representative p16 and p15 Western blot. β-actin and Ponceau staining, loading controls. B: Examples of p16 immunohistolabeling. Strong positivity, score of 2; positive staining, score of 1; few cells expressing the protein with a weak staining, score of 0.5; and negative staining, score of 0. Scale bar = 40 μm. C: p16 expression scoring repartition in the different TP53 tumor types. p16 immunohistochemistry scores were established as described above. *P < 0.05; **P < 0.01 (Fisher's exact test).

References

    1. Chibon F, Mariani O, Derré J, Malinge S, Coindre JM, Guillou L, Lagacé R, Aurias A. A subgroup of malignant fibrous histiocytomas is associated with genetic changes similar to those of well-differentiated liposarcomas. Cancer Genet Cytogenet. 2002;139:24–29. - PubMed
    1. Chibon F, Mariani O, Mairal A, Derré J, Coindre JM, Terrier P, Lagacé R, Sastre X, Aurias A. The use of clustering software for the classification of comparative genomic hybridization data. An analysis of 109 malignant fibrous histiocytomas. Cancer Genet Cytogenet. 2003;141:75–78. - PubMed
    1. Coindre JM, Mariani O, Chibon F, Mairal A, De Saint Aubain Somerhausen N, Favre-Guillevin E, Bui NB, Stoeckle E, Hostein I, Aurias A. Most malignant fibrous histiocytomas developed in the retroperitoneum are dedifferentiated liposarcomas: a review of 25 cases initially diagnosed as malignant fibrous histiocytoma. Mod Pathol. 2003;16:256–262. - PubMed
    1. Derré J, Lagacé R, Nicolas A, Mairal A, Chibon F, Coindre JM, Terrier P, Sastre X, Aurias A. Leiomyosarcomas and most malignant fibrous histiocytomas share very similar comparative genomic hybridization imbalances: an analysis of a series of 27 leiomyosarcomas. Lab Invest. 2001;81:211–215. - PubMed
    1. Fletcher CDM, Unni KK, Mertens F. Pathology and genetics of tumours of soft tissue and bone. IARC Press; Lyon: 2002. World Health Organisation classification of tumours.

Publication types

MeSH terms

Substances