. 2010 Sep;5(10):1666-77.
doi: 10.1038/nprot.2010.129. Epub 2010 Sep 23.

Fluorescent labeling of tetracysteine-tagged proteins in intact cells

Affiliations

Fluorescent labeling of tetracysteine-tagged proteins in intact cells

Carsten Hoffmann et al. Nat Protoc. 2010 Sep.

Abstract

In this paper, we provide a general protocol for labeling proteins with the membrane-permeant fluorogenic biarsenical dye fluorescein arsenical hairpin binder-ethanedithiol (FlAsH-EDT₂). Generation of the tetracysteine-tagged protein construct by itself is not described, as this is a protein-specific process. This method allows site-selective labeling of proteins in living cells and has been applied to a wide variety of proteins and biological problems. We provide here a generally applicable labeling procedure and discuss the problems that can occur as well as general considerations that must be taken into account when designing and implementing the procedure. The method can even be applied to proteins with expression below 1 pmol mg⁻¹ of protein, such as G protein-coupled receptors, and it can be used to study the intracellular localization of proteins as well as functional interactions in fluorescence resonance energy transfer experiments. The labeling procedure using FlAsH-EDT₂ as described takes 2-3 h, depending on the number of samples to be processed.


Figures

Figure 1
Figure 1
Time dependence of FlAsH binding to the target sequence. The figure is modified with permission from Hoffmann et al.. HEK293 cells transiently transfected with the construct A2A-CFP-Flash-C (containing the CCPGCC sequence) were incubated at the indicated time points with 500 nM FlAsH. Binding of FlAsH to this sequence was monitored by the quenching of the emission of CFP, which was measured at 450–515 nm every 3 min. After the decrease in CFP fluorescence had reached a plateau, cells were washed with 250 µM EDT to reduce nonspecific binding. Addition of 5 mM BAL completely reversed nonspecific binding of FlAsH within 10 min, with little effect on specific binding (as seen from the continued quenching of CFP fluorescence).
Figure 2
Figure 2
Specific labeling with FlAsH can only be seen after appropriate washing. Confocal images of a human A2A-adenosine receptor construct with the tetracysteine motif CCPGCC in intracellular loop 3 and CFP at the C-terminus at position Gly-340 (A2A-Flash3-CFP) transiently expressed in HEK293 cells. Cells were imaged 48 h after transfection. The top row shows cells after labeling with 500 nM FlAsH according to the protocol without washing (thus, without Steps 11–13). The bottom row shows the same cells 10 min after addition of 250 µM EDT according to the protocol. The left column shows images excited at 430 nm and emission from 470–550 nm (i.e., CFP fluorescence); the middle column shows the same cells excited at 514 nm and emission measured from 530–600 nm (i.e., FlAsH fluorescence). After addition of EDT, the fluorescence intensity of FlAsH-labeled cells was 15- to 20-fold over background of nontransfected neighboring cells. Note that the mere addition of EDT does not represent the full washing procedure and that better background reduction is obtained with the full procedure. The right column represents the transmission images of cells. The white scale bar = 10 µm.
Figure 3
Figure 3
Reduction of FlAsH binding to different tetracysteine motifs by BAL. Removal of label from tetracysteine motifs was achieved by addition of BAL. The experiment was done with two constructs, derived again from the human A2A-adenosine receptor. Both constructs carried a CFP in the terminus to quantify FlAsH binding and were stably expressed in HEK-293 cells. The construct termed CCPGCC is identical to the one used in Figure 2; the CCPGCC motif in this construct is flanked by the normal A2A sequence environment, finally reading ESQCCPGCCARS. In the construct termed FLNCCPGCCMEP, the binding motif was introduced N-terminally to the CFP, replacing the corresponding amino acids of the A2A receptor. Cells were labeled with FlAsH, and membranes from these labeled cells were prepared as described. Fluorescence spectra of homogenized membranes were measured in a fluorescence spectrophotometer. Thereafter, BAL was added at increasing concentrations, and for each concentration, fluorescence spectra were recorded after 10 min of incubation time. Spectra were recorded using 436-nm excitation (excitation bandwidth 5 nm) and emission was recorded from 460 to 700 nm (bandwidth 5 nm, scan speed 200 nm min −1). The ratios of the fluorescence emission peaks at 480 nm (CFP) and 528 nm (FlAsH) were calculated and plotted against increasing BAL concentrations to determine the fraction of FlAsH bound (as percentage of the prewash value). Squares represent the basic CCPGCC motif, whereas circles represent data for the motif FLNCCPGCCMEP. Note that the optimized motifs exhibit a much greater (10- to 30-fold) resistance to displacement by BAL. The figure is modified with permission from Zürn et al..
Figure 4
Figure 4
Comparison of BAL and EDT for removing FlAsH from its target sequences. HEK293 cells stably expressing α2A-adrenergic receptors and carrying the CCPGCC motif (in the third intracellular loop) were incubated with FlAsH as described in the above protocol, and then membranes from these cells were prepared. Fluorescence spectra of homogenized membranes were measured in a fluorescence spectrophotometer as in Figure 3. Thereafter, BAL or EDT was added at increasing concentrations; at each concentration, fluorescence spectra were recorded after 10 min of incubation. BAL had an approximately threefold higher potency than EDT in displacing FlAsH from its specific binding motif.
Figure 5
Figure 5
Labeling of the cytosolic protein β-arrestin-2 with FlAsH. A β-arrestin-2-CCPGCC construct and the human PTH (parathyroid hormone) receptor were transiently expressed in HEK293 cells. At 48 h after transfection, the cells were labeled according to this protocol. Top row: cells labeled with FlAsH were excited at 514 nm and emission was measured from 530–600 nm (i.e., FlAsH fluorescence). The right column represents transmission images of the cells. The white scale bar = 10 µm. Bottom: the same cells were monitored 9 min after addition of 1 µM PTH (1–34). After PTH (1–34) addition, a clear translocation of FlAsH-labeled β-arrestin-2-CCPGCC to the membrane is visible, indicating that cytosolic proteins such as β-arrestin-2 can be specifically labeled and maintain their function. The figure is modified with permission from Zürn et al..
Figure 6
Figure 6
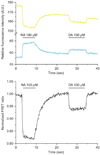
Dynamic FRET measurements between CFP and FlAsH. HEK293 cells stably expressing an α2A-adrenergic receptor construct, carrying the CCPGCC motif in the third intracellular loop and CFP at the C-terminus (α2A-Flash3-CFP adrenergic receptor), were labeled with FlAsH according to the protocol. The cells were placed on the FRET setup and perfused with buffer alone or with saturating conditions of norepinephrine or dopamine. The top panel shows the corrected CFP and FlAsH channels of a typical experiment (A.U., arbitrary units), whereas the bottom panel shows the trace of the normalized FRET ratio of the same experiment.
Figure 7
Figure 7
Labeling of extracellular tetracysteine-tagged proteins by membrane-impermeant biarsenical dyes. Wide-field images of HEK293 cells transiently transfected with FLNCCPGCCMEP-Myc-V2R-CeFP vasopressin receptor and stained for 10 min with the following: (top row) 2.5 µM sulfo-FlAsH (sFlAsH)-EDT2 (ref. 20) and 10 µM EDT after a 30-min preincubation with 5 mM 2-mercaptoethanesulfonate (MES); (middle row) 2.5 µM sFlAsH-EDT2 and 10 µM EDT after a 30-min preincubation with 0.5 mM tris(carboxyethyl)phosphine (TCEP) and 5 mM MES; (bottom row) 2.5 µM ReAsH-EDT2 and 5 µM 2,3-dimercaptopropane-sulfonate (DMPS) after a 30-min preincubation with 0.5 mM TCEP and 5 mM MES. Reducing agents were retained during staining and removed with unbound dye by washing with 100 µM DMPS for 10 min before imaging. All procedures were carried out at 37 °C in HBSS/glucose. DIC, differential interference contrast. The white scale bar = 10 µm.

References

    1. Sletten EM, Bertozzi CR. Bioorthogonal chemistry: fishing for selectivity in a sea of functionality. Angew. Chem. Int. Ed. Engl. 2009;48:6974–6998. - PMC - PubMed
    1. Shaner NC, Steinbach PA, Tsien RY. A guide to choosing fluorescent proteins. Nat. Methods. 2005;2:905–909. - PubMed
    1. Giepmans BN, Adams SR, Ellisman MH, Tsien RY. The fluorescent toolbox for assessing protein location and function. Science. 2006;312:217–224. - PubMed
    1. Gautier A, et al. An engineered protein tag for multiprotein labeling in living cells. Chem. Biol. 2008;15:128–136. - PubMed
    1. Gronemeyer T, Godin G, Johnsson K. Adding value to fusion proteins through covalent labelling. Curr. Opin. Biotechnol. 2005;16:453–458. - PubMed

Publication types