

Effect of the cannabinoid receptor-1 antagonist rimonabant on inflammation in mice with diet-induced obesity
- PMID: 20885384
- PMCID: PMC3272877
- DOI: 10.1038/oby.2010.213
Effect of the cannabinoid receptor-1 antagonist rimonabant on inflammation in mice with diet-induced obesity
Abstract
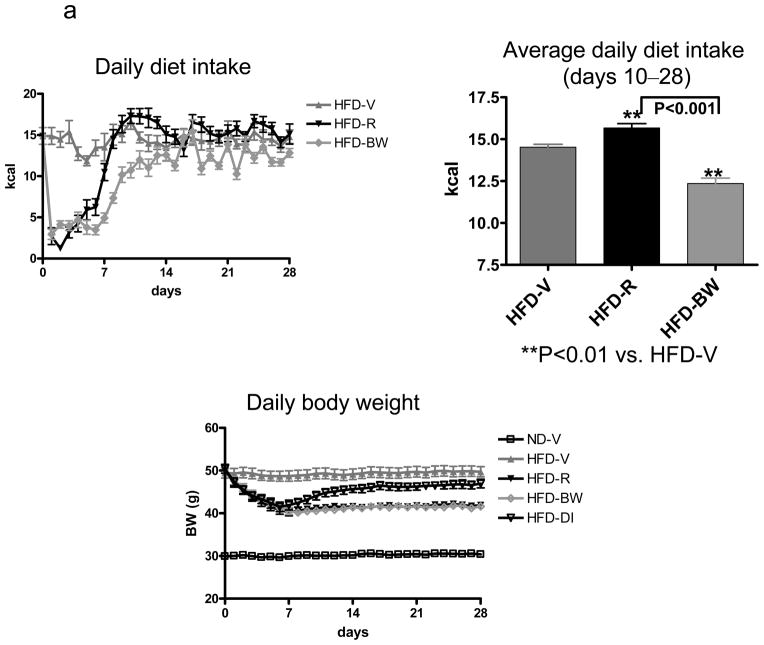
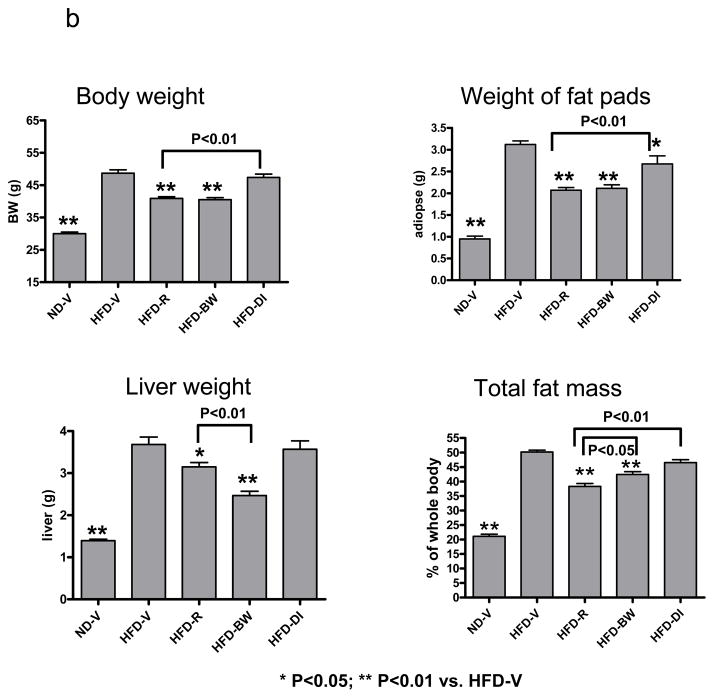
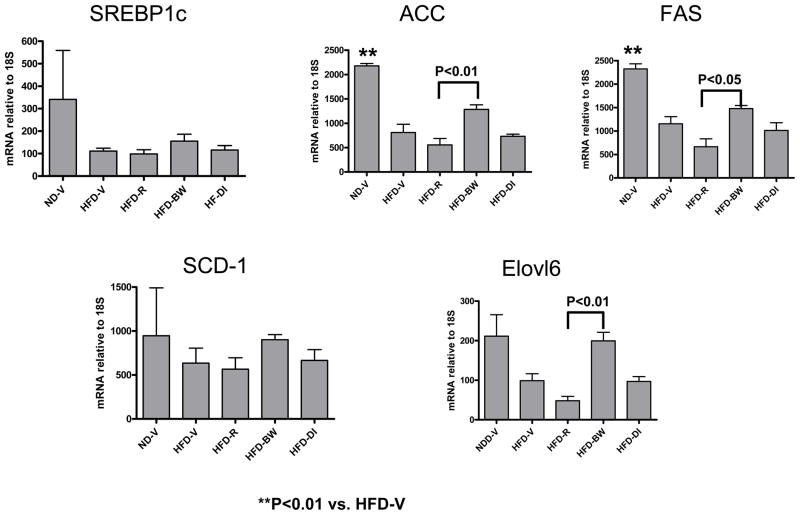
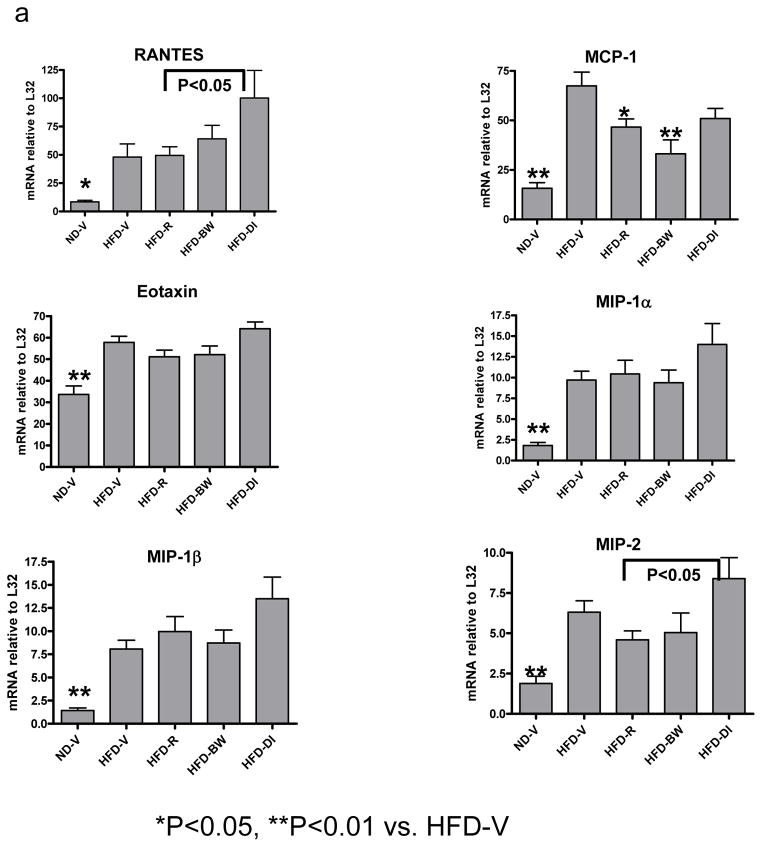
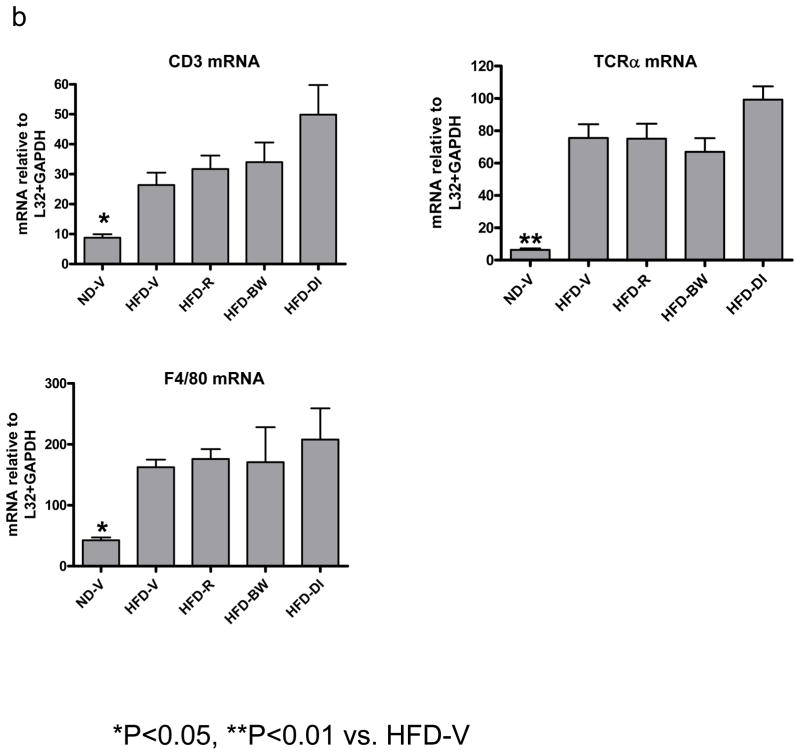
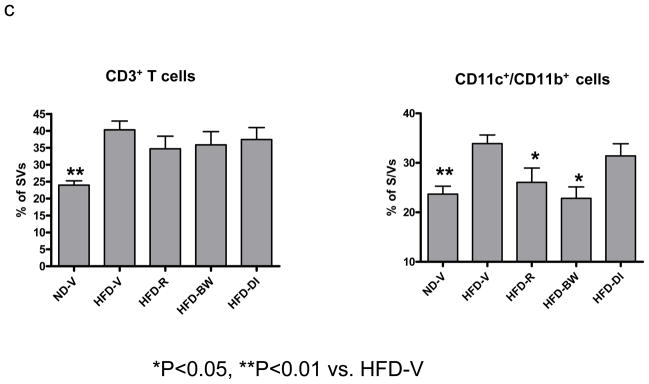
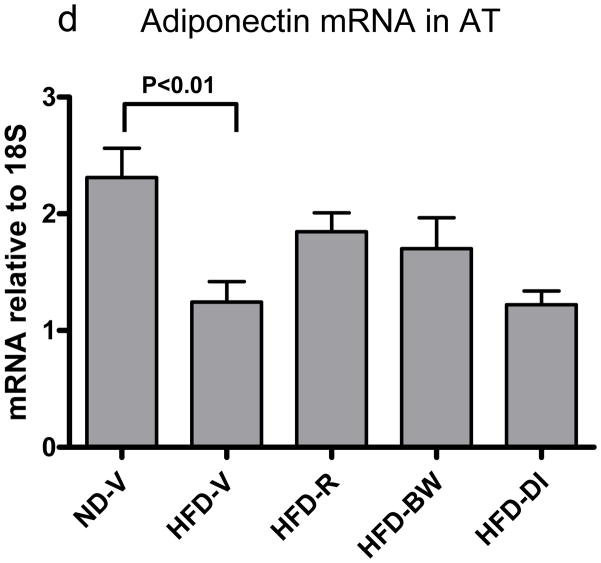
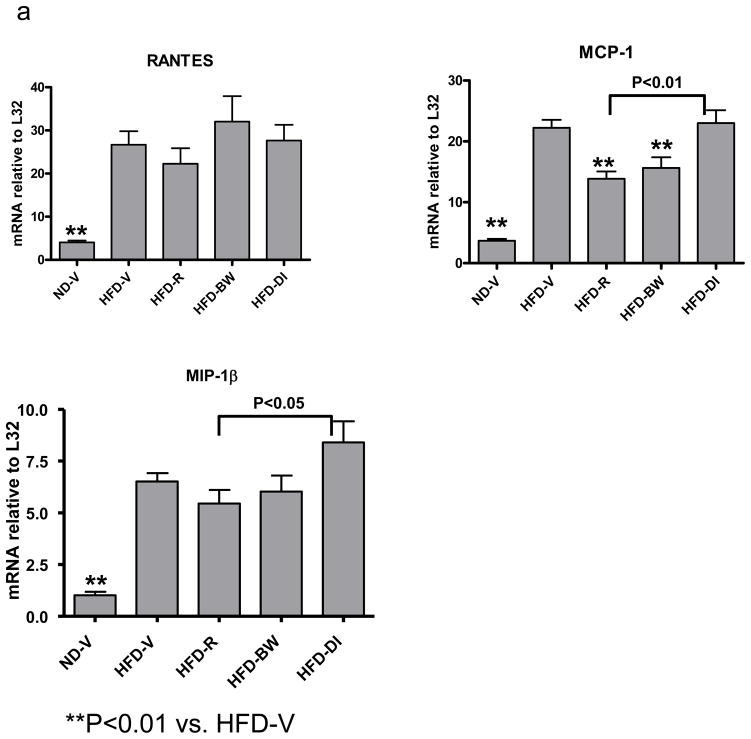
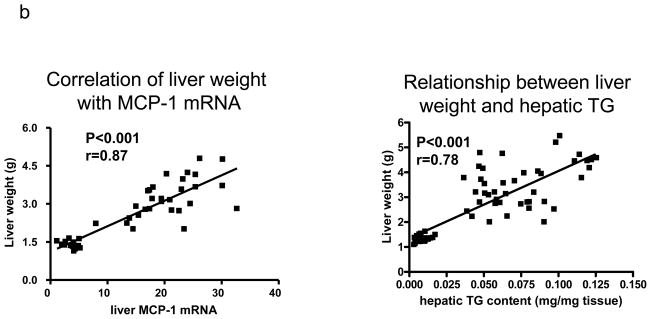
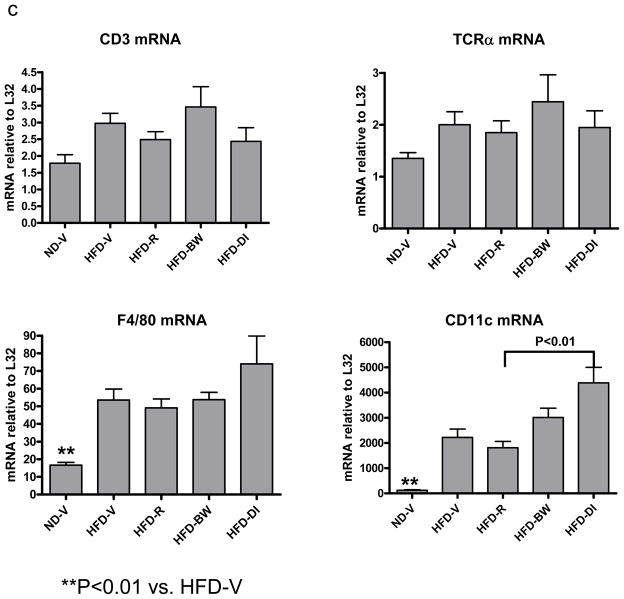
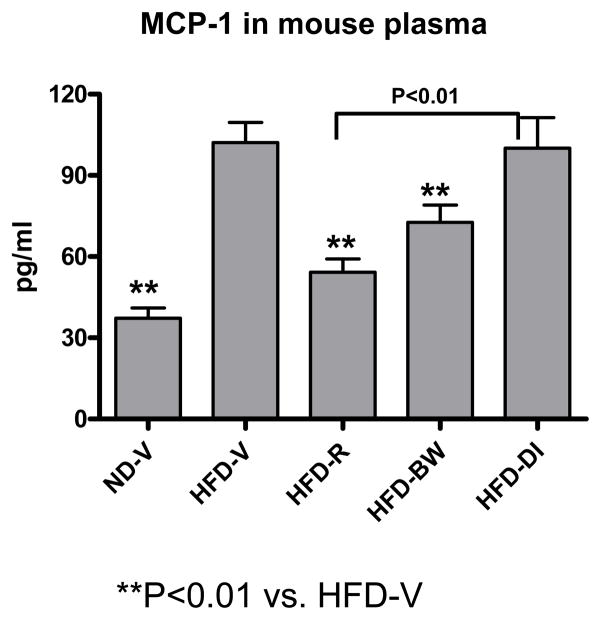
We studied whether cannabinoid receptor (CB1) blockade with rimonabant has an anti-inflammatory effect in obese mice, and whether this effect depends on weight loss and/or diet consumption. High-fat diet (HFD)-induced obese mice were treated orally with rimonabant (HFD-R) or vehicle (HFD-V) for 4 weeks. Paired-feeding was conducted in two additional groups of obese mice to achieve either the same body weight (HFD-BW) or the same HFD intake (HFD DI) as HFD-R. All these groups of mice were maintained on HFD throughout, with mice on normal diet (ND) throughout as lean controls. Rimonabant treatment of obese mice induced marked diet-intake reduction and weight loss during the first week, which was followed by maintenance of low body weight but not diet-intake reduction. Lower HFD intake was required to reach the same degree of weight loss in HFD-BW. HFD-DI had similar weight loss initially, but then started to gain weight, reaching a higher body weight than HFD-R. Despite the same degree of weight loss, HFD-R had less fat mass and lower adipogenic gene expression than HFD-BW. Compared to HFD-V or HFD-DI, HFD-R had reduced inflammation in adipose tissue (AT) and/or liver indicated primarily by lower monocyte chemoattractant protein-1 (MCP-1) levels. However, MCP-1 levels were not significantly different between HFD-R and HFD-BW. In vitro incubation of rimonabant with AT explants did not change MCP-1 levels. Thus, rimonabant induced weight loss in obese mice by diet-intake-dependent and -independent fashions. Rimonabant decreased inflammation in obese mice, possibly through a primary effect on weight reduction.
Figures
Similar articles
-
Effects of chronic oral rimonabant administration on energy budgets of diet-induced obese C57BL/6 mice.Obesity (Silver Spring). 2012 May;20(5):954-62. doi: 10.1038/oby.2011.357. Epub 2011 Dec 15. Obesity (Silver Spring). 2012. PMID: 22173576
-
Anti-obesity effects of the combined administration of CB1 receptor antagonist rimonabant and melanin-concentrating hormone antagonist SNAP-94847 in diet-induced obese mice.Int J Obes (Lond). 2013 Feb;37(2):279-87. doi: 10.1038/ijo.2012.35. Epub 2012 Apr 3. Int J Obes (Lond). 2013. PMID: 22473329
-
The central cannabinoid CB1 receptor is required for diet-induced obesity and rimonabant's antiobesity effects in mice.Obesity (Silver Spring). 2011 Oct;19(10):1923-34. doi: 10.1038/oby.2011.250. Epub 2011 Jul 28. Obesity (Silver Spring). 2011. PMID: 21799481
-
Is the cannabinoid CB1 receptor antagonist rimonabant advancing the treatment of obesity?Expert Opin Pharmacother. 2005 Oct;6(12):2141-4. doi: 10.1517/14656566.6.12.2141. Expert Opin Pharmacother. 2005. PMID: 16197364 Review. No abstract available.
-
[Rimonabant (Acomplia), specific inhibitor of the endocannabinoid system].J Pharm Belg. 2005;60(3):89-91. J Pharm Belg. 2005. PMID: 16252510 Review. French.
Cited by
-
The Impact of CB1 Receptor on Inflammation in Skeletal Muscle Cells.J Inflamm Res. 2021 Aug 14;14:3959-3967. doi: 10.2147/JIR.S322247. eCollection 2021. J Inflamm Res. 2021. PMID: 34421307 Free PMC article.
-
Inhibiting the CB1 receptor in CIH-induced animal model alleviates colon injury.Appl Microbiol Biotechnol. 2024 Jun 18;108(1):380. doi: 10.1007/s00253-024-13216-0. Appl Microbiol Biotechnol. 2024. PMID: 38888634 Free PMC article.
-
Rimonabant Improves Oxidative/Nitrosative Stress in Mice with Nonalcoholic Fatty Liver Disease.Oxid Med Cell Longev. 2015;2015:842108. doi: 10.1155/2015/842108. Epub 2015 May 11. Oxid Med Cell Longev. 2015. PMID: 26078820 Free PMC article.
-
Blockade of CB1 cannabinoid receptor alters gut microbiota and attenuates inflammation and diet-induced obesity.Sci Rep. 2017 Nov 15;7(1):15645. doi: 10.1038/s41598-017-15154-6. Sci Rep. 2017. PMID: 29142285 Free PMC article.
-
Translational Modeling to Guide Study Design and Dose Choice in Obesity Exemplified by AZD1979, a Melanin-concentrating Hormone Receptor 1 Antagonist.CPT Pharmacometrics Syst Pharmacol. 2017 Jul;6(7):458-468. doi: 10.1002/psp4.12199. Epub 2017 May 27. CPT Pharmacometrics Syst Pharmacol. 2017. PMID: 28556607 Free PMC article.
References
-
- Wu H, Ghosh S, Perrard XD, et al. T-cell accumulation and regulated on activation, normal T cell expressed and secreted upregulation in adipose tissue in obesity. Circulation. 2007;115:1029–1038. - PubMed
-
- Berg AH, Combs TP, Du X, Brownlee M, Scherer PE. The adipocyte-secreted protein Acrp30 enhances hepatic insulin action. Nat Med. 2001;7:947–953. - PubMed
-
- Hotamisligil GS. Inflammation and metabolic disorders. Nature. 2006;444:860–867. - PubMed
Publication types
MeSH terms
Substances
Grants and funding
LinkOut - more resources
Full Text Sources
Other Literature Sources
Medical
Research Materials
Miscellaneous
