. 2010 Oct 1;49(28):5399-406.
doi: 10.1364/AO.49.005399.

Hyperspectral Shack-Hartmann test

Affiliations

Hyperspectral Shack-Hartmann test

Gabriel C Birch et al. Appl Opt. .

Abstract

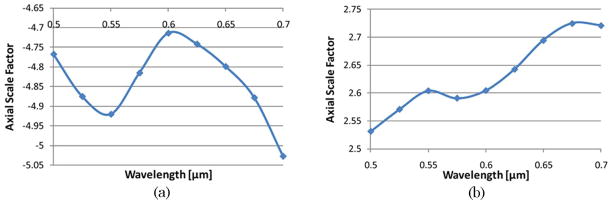
A hyperspectral Shack-Hartmann test bed has been developed to characterize the performance of miniature optics across a wide spectral range, a necessary first step in developing broadband achromatized all-polymer endomicroscopes. The Shack-Hartmann test bed was used to measure the chromatic focal shift (CFS) of a glass singlet lens and a glass achromatic lens, i.e., lenses representing the extrema of CFS magnitude in polymer elements to be found in endomicroscope systems. The lenses were tested from 500 to 700 nm in 5 and 10 nm steps, respectively. In both cases, we found close agreement between test results obtained from a ZEMAX model of the test bed and test lens and those obtained by experiment (maximum error of 12 μm for the singlet lens and 5 μm for the achromatic triplet lens). Future applications of the hyperspectral Shack-Hartmann test include measurements of aberrations as a function of wavelength, characterization of manufactured plastic endomicroscope elements and systems, and reverse optimization.


Figures

Fig. 1
Fig. 1
(Color online) Spectrum of applications and the associated wavelength ranges. Blue bars denote the approximate excitation waveband, and gray bars denote the approximate emission waveband. Acronyms: CLSM, confocal laser scanning microscopy [4]; (SHG), second harmonic generation [37]; LED, light emitting diode; STED, stimulated emission depletion [38]; 2PEF, two-photon excited fluorescence.
Fig. 2
Fig. 2
(Color online) PMMA and polystyrene doublet. See text for details.
Fig. 3
Fig. 3
(Color online) Best-performing achromatic doublet designed using optical-polymer materials (PMMA and PS). The lens diameter is 3 mm and the total lens thickness is 4.1 mm. A.S., aperture stop. Part (b) shows the chromatic focal shift for the doublet design of (a). See text for details.
Fig. 4
Fig. 4
(Color online) Schematic representation of the hyperspectral Shack–Hartmann test bed. The inset illustrates how wavefront deformations in the exit pupil of the lens (or system) under test are converted to lenslet focal-spot displacements.
Fig. 5
Fig. 5
(Color online) Axial scale factors measured for singlet (a) and doublet (b) test lenses. The axial scale factor is determined in 25 nm increments of wavelength.
Fig. 6
Fig. 6
(Color online) Black box representing the size of a single pixel (5.2 μm × 5.2 μm) in our camera. Blue crosses represent the focal-spot centroids calculated for a series of 200 sequential measurements from a single lenslet at a fixed test-lens position and fixed wavelength. Noise in the system contributes to reduced precision of the centroid calculation. These centroids are averaged together to produce a single centroid location for this lenslet at this wavelength, which will then be processed with the Shack–Hartmann analysis software.
Fig. 7
Fig. 7
(Color online) Predicted and measured hyperspectral Shack–Hartmann test results. Part (a) compares the predicted spectral change in focal length for a singlet lens to experimental measurements with the hyperspectral Shack–Hartmann test. Part (b) compares the predicted spectral change in focal length for a triplet achromatic lens to experimental measurements with the hyperspectral Shack–Hartmann test. Note the change in the ordinate-axis scale between Parts (a) and (b). See text for details.
Fig. 8
Fig. 8
(Color online) ZEMAX predicted axial chromatic focal shift for PMMA/polystyrene achromatized doublet. Blue regions denote shifts in focal length that are larger than the smallest focal length shift experimentally detected in the triplet achromat below 20% relative error. Yellow regions denote shifts in focal length that are smaller than the smallest focal length shift experimentally detected from the triplet achromat above 20% relative error.

References

    1. Liang C. Miniature microscope objective lens. 7,023,622. US patent. 2006 April 4;
    1. McCall BP, Birch G, Descour MR, Tkaczyk TS. Fabrication of microlens array by diamond milling with spherical shaped milling tools. Proc SPIE. 2010;7590:75900A. (SPIE)
    1. Kester RT, Christenson T, Kortum RR, Tkaczyk TS. Low cost, high performance, self-aligning miniature optical systems. Appl Opt. 2009;48:3375–3384. - PMC - PubMed
    1. Liang C, Descour MR, Sung KB, Richards-Kortum R. Fiber confocal reflectance microscope (FCRM) for in vivo imaging. Opt Express. 2001;9:821–830. - PubMed
    1. ISO Standard 19012–2. International Organization for Standardization; 2009. Photography—electronic still-picture cameras—resolution measurements.

Publication types