

Analysis of the Basidiomycete Coprinopsis cinerea reveals conservation of the core meiotic expression program over half a billion years of evolution
- PMID: 20885784
- PMCID: PMC2944786
- DOI: 10.1371/journal.pgen.1001135
Analysis of the Basidiomycete Coprinopsis cinerea reveals conservation of the core meiotic expression program over half a billion years of evolution
Abstract
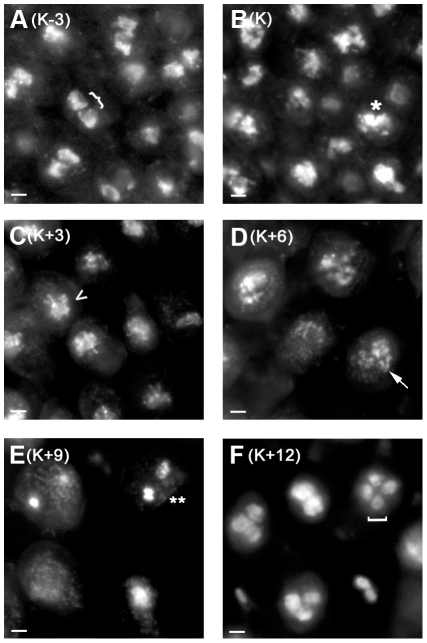
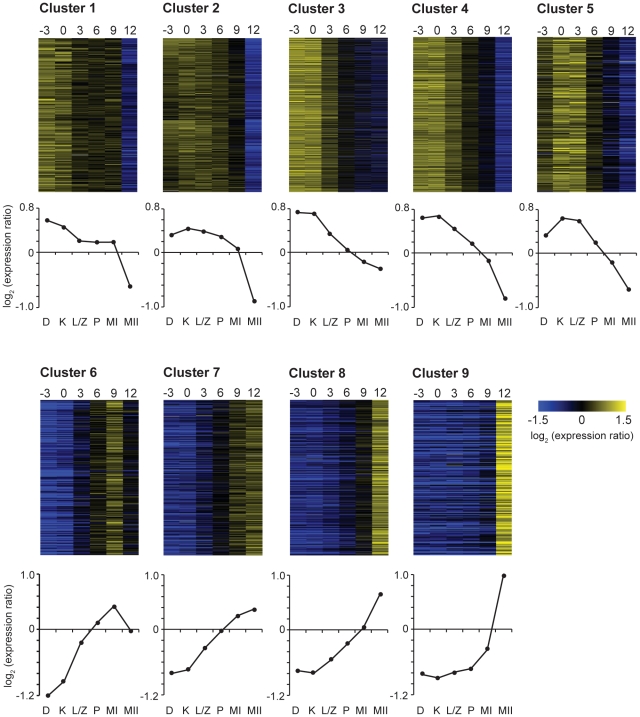
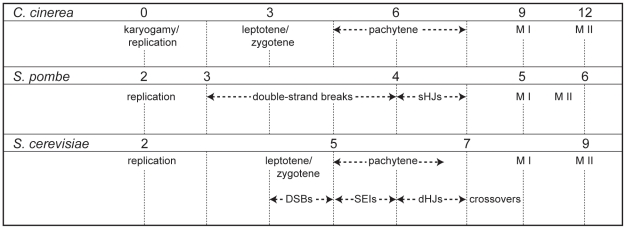
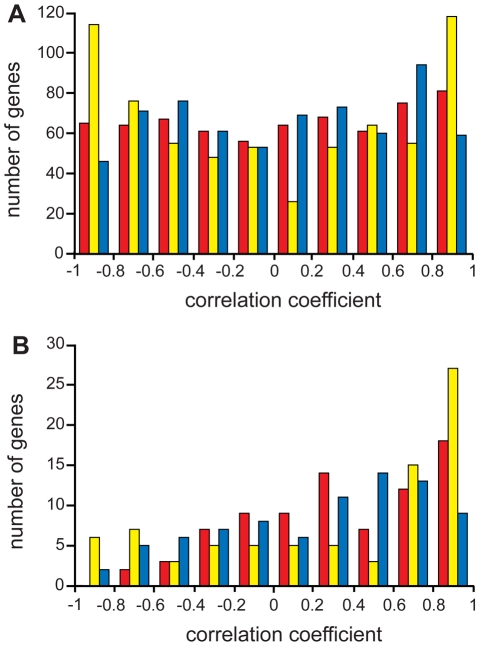
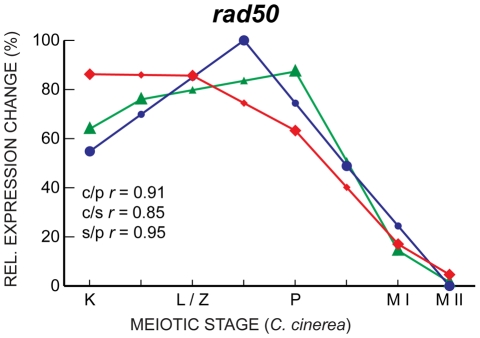
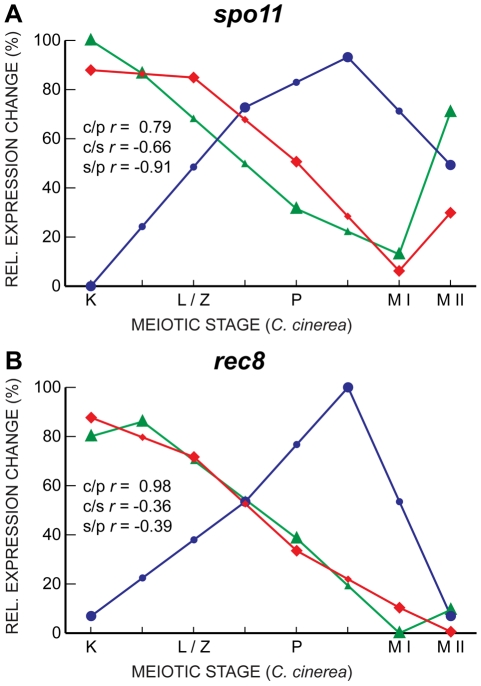
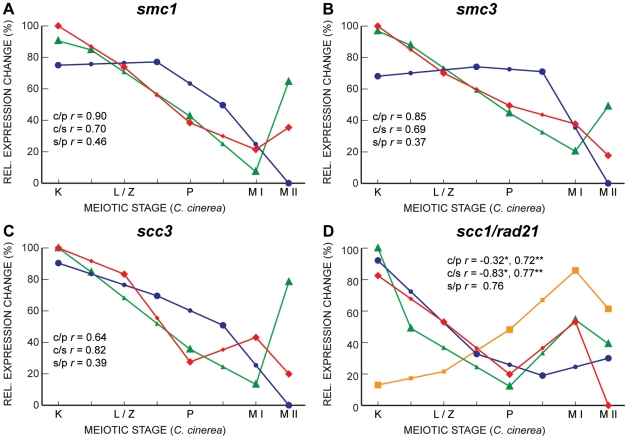
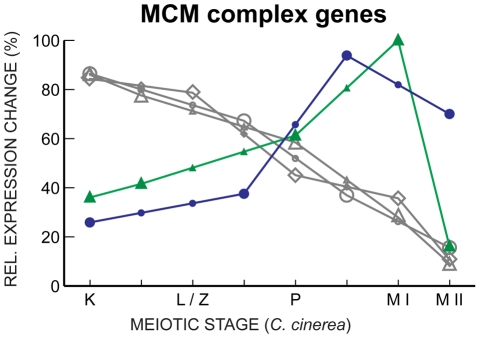
Coprinopsis cinerea (also known as Coprinus cinereus) is a multicellular basidiomycete mushroom particularly suited to the study of meiosis due to its synchronous meiotic development and prolonged prophase. We examined the 15-hour meiotic transcriptional program of C. cinerea, encompassing time points prior to haploid nuclear fusion though tetrad formation, using a 70-mer oligonucleotide microarray. As with other organisms, a large proportion (∼20%) of genes are differentially regulated during this developmental process, with successive waves of transcription apparent in nine transcriptional clusters, including one enriched for meiotic functions. C. cinerea and the fungi Saccharomyces cerevisiae and Schizosaccharomyces pombe diverged ∼500-900 million years ago, permitting a comparison of transcriptional programs across a broad evolutionary time scale. Previous studies of S. cerevisiae and S. pombe compared genes that were induced upon entry into meiosis; inclusion of C. cinerea data indicates that meiotic genes are more conserved in their patterns of induction across species than genes not known to be meiotic. In addition, we found that meiotic genes are significantly more conserved in their transcript profiles than genes not known to be meiotic, which indicates a remarkable conservation of the meiotic process across evolutionarily distant organisms. Overall, meiotic function genes are more conserved in both induction and transcript profile than genes not known to be meiotic. However, of 50 meiotic function genes that were co-induced in all three species, 41 transcript profiles were well-correlated in at least two of the three species, but only a single gene (rad50) exhibited coordinated induction and well-correlated transcript profiles in all three species, indicating that co-induction does not necessarily predict correlated expression or vice versa. Differences may reflect differences in meiotic mechanisms or new roles for paralogs. Similarities in induction, transcript profiles, or both, should contribute to gene discovery for orthologs without currently characterized meiotic roles.
Conflict of interest statement
The authors have declared that no competing interests exist.
Figures
Similar articles
-
Global gene expression in Coprinopsis cinerea meiotic mutants reflects checkpoint arrest.G3 (Bethesda). 2012 Oct;2(10):1213-21. doi: 10.1534/g3.112.003046. Epub 2012 Oct 1. G3 (Bethesda). 2012. PMID: 23050232 Free PMC article.
-
Insights into evolution of multicellular fungi from the assembled chromosomes of the mushroom Coprinopsis cinerea (Coprinus cinereus).Proc Natl Acad Sci U S A. 2010 Jun 29;107(26):11889-94. doi: 10.1073/pnas.1003391107. Epub 2010 Jun 14. Proc Natl Acad Sci U S A. 2010. PMID: 20547848 Free PMC article.
-
Dmc1 of Schizosaccharomyces pombe plays a role in meiotic recombination.Nucleic Acids Res. 2000 Jul 15;28(14):2709-16. doi: 10.1093/nar/28.14.2709. Nucleic Acids Res. 2000. PMID: 10908327 Free PMC article.
-
Control of meiotic gene expression in Saccharomyces cerevisiae.Microbiol Rev. 1994 Mar;58(1):56-70. doi: 10.1128/mr.58.1.56-70.1994. Microbiol Rev. 1994. PMID: 8177171 Free PMC article. Review.
-
Fungal Sex: The Basidiomycota.Microbiol Spectr. 2017 Jun;5(3):10.1128/microbiolspec.funk-0046-2016. doi: 10.1128/microbiolspec.FUNK-0046-2016. Microbiol Spectr. 2017. PMID: 28597825 Free PMC article. Review.
Cited by
-
Mapping Recombination Landscape and Basidial Spore Number in the Button Mushroom Agaricus bisporus.Front Fungal Biol. 2021 Aug 20;2:711330. doi: 10.3389/ffunb.2021.711330. eCollection 2021. Front Fungal Biol. 2021. PMID: 37744108 Free PMC article.
-
An Overview of the Function and Maintenance of Sexual Reproduction in Dikaryotic Fungi.Front Microbiol. 2018 Mar 21;9:503. doi: 10.3389/fmicb.2018.00503. eCollection 2018. Front Microbiol. 2018. PMID: 29619017 Free PMC article. Review.
-
Wheat flour, an inexpensive medium for in vitro cultivation of coprophilous fungus Coprinopsis cinerea.Curr Res Environ Appl Mycol J Fungal Biol. 2017;7(3):144-154. Epub 2017 Jul 20. Curr Res Environ Appl Mycol J Fungal Biol. 2017. PMID: 35433389 Free PMC article.
-
Conserved meiotic machinery in Glomus spp., a putatively ancient asexual fungal lineage.Genome Biol Evol. 2011;3:950-8. doi: 10.1093/gbe/evr089. Epub 2011 Aug 29. Genome Biol Evol. 2011. PMID: 21876220 Free PMC article.
-
Genome editing in the mushroom-forming basidiomycete Coprinopsis cinerea, optimized by a high-throughput transformation system.Sci Rep. 2017 Apr 28;7(1):1260. doi: 10.1038/s41598-017-00883-5. Sci Rep. 2017. PMID: 28455526 Free PMC article.
References
-
- Redhead SA, Vilgalys R, Moncalvo JM, Johnson J, Hopple JS. Coprinus Pers. and the disposition of Coprinus species sensu lato. Taxon. 2001;50:203–241.
-
- Raju NB, Lu BC. Meiosis in Coprinus. 3: Timing of meiotic events in C. lagopus (sensu Buller). Canadian Journal of Botany. 1970;48:2183–2186.
-
- Page SL, Hawley RS. The genetics and molecular biology of the synaptonemal complex. Annual Review of Cell and Developmental Biology. 2004;20:525–558. - PubMed
-
- Henderson KA, Keeney S. Synaptonemal complex formation: where does it start? Bioessays. 2005;27:995–998. - PubMed
-
- Li WX, Ma H. Double-stranded DNA breaks and gene functions in recombination and meiosis. Cell Research. 2006;16:402–412. - PubMed
Publication types
MeSH terms
Substances
Associated data
- Actions
- Actions
Grants and funding
LinkOut - more resources
Full Text Sources
Other Literature Sources
Molecular Biology Databases
Research Materials
Miscellaneous
