

A novel statistic for genome-wide interaction analysis
- PMID: 20885795
- PMCID: PMC2944798
- DOI: 10.1371/journal.pgen.1001131
A novel statistic for genome-wide interaction analysis
Abstract
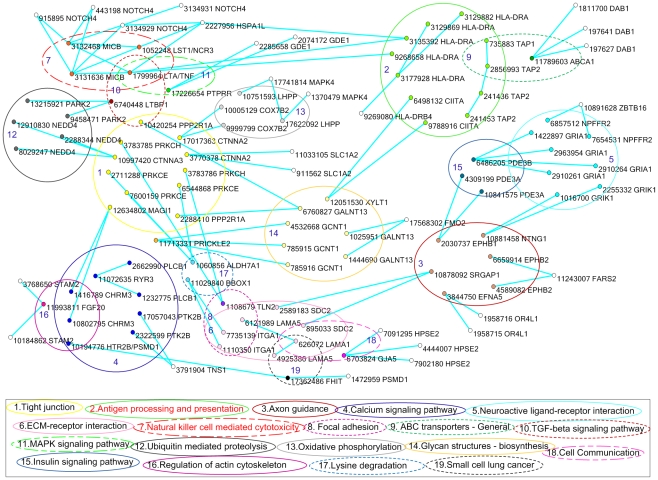
Although great progress in genome-wide association studies (GWAS) has been made, the significant SNP associations identified by GWAS account for only a few percent of the genetic variance, leading many to question where and how we can find the missing heritability. There is increasing interest in genome-wide interaction analysis as a possible source of finding heritability unexplained by current GWAS. However, the existing statistics for testing interaction have low power for genome-wide interaction analysis. To meet challenges raised by genome-wide interactional analysis, we have developed a novel statistic for testing interaction between two loci (either linked or unlinked). The null distribution and the type I error rates of the new statistic for testing interaction are validated using simulations. Extensive power studies show that the developed statistic has much higher power to detect interaction than classical logistic regression. The results identified 44 and 211 pairs of SNPs showing significant evidence of interactions with FDR<0.001 and 0.001<FDR<0.003, respectively, which were seen in two independent studies of psoriasis. These included five interacting pairs of SNPs in genes LST1/NCR3, CXCR5/BCL9L, and GLS2, some of which were located in the target sites of miR-324-3p, miR-433, and miR-382, as well as 15 pairs of interacting SNPs that had nonsynonymous substitutions. Our results demonstrated that genome-wide interaction analysis is a valuable tool for finding remaining missing heritability unexplained by the current GWAS, and the developed novel statistic is able to search significant interaction between SNPs across the genome. Real data analysis showed that the results of genome-wide interaction analysis can be replicated in two independent studies.
Conflict of interest statement
The authors have declared that no competing interests exist.
Figures
 in dataset
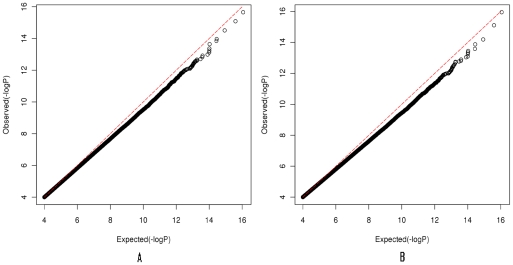
1. The P-values (<
in dataset
1. The P-values (< ) for the
test are plotted (as −log10 values) as a function of its expected
p values. (B) Quantile-quantile plots for the test statistic
) for the
test are plotted (as −log10 values) as a function of its expected
p values. (B) Quantile-quantile plots for the test statistic
 in dataset
2. The P-values (<
in dataset
2. The P-values (< ) for the
test are plotted (as −log10 values) as a function of its expected
p values.
) for the
test are plotted (as −log10 values) as a function of its expected
p values.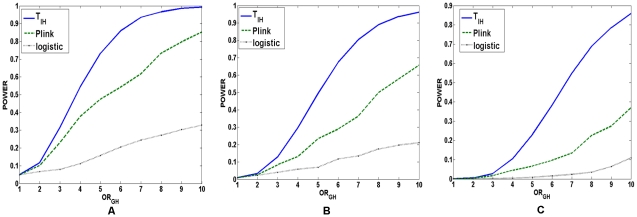
 , the
“fast-epistasis” in PLINK and logistic regression analysis
for testing interaction between two linked loci as a function of
traditional odds-ratio
, the
“fast-epistasis” in PLINK and logistic regression analysis
for testing interaction between two linked loci as a function of
traditional odds-ratio  under a
two-locus recessive
under a
two-locus recessive recessive
disease model, where the number of individuals in both the case and
control groups is 2,000, the significance level is 0.05, and the
odds-ratios at two loci were
recessive
disease model, where the number of individuals in both the case and
control groups is 2,000, the significance level is 0.05, and the
odds-ratios at two loci were  . (B) The
power of the test statistic
. (B) The
power of the test statistic  , the
“fast-epistasis” in PLINK and logistic regression analysis
for testing interaction between two linked loci as a function of
traditional odds-ratio
, the
“fast-epistasis” in PLINK and logistic regression analysis
for testing interaction between two linked loci as a function of
traditional odds-ratio  under a
two-locus recessive
under a
two-locus recessive recessive
disease model, where the number of individuals in both the case and
control groups is 2,000, the significance level is 0.01, and the
odds-ratios at two loci were
recessive
disease model, where the number of individuals in both the case and
control groups is 2,000, the significance level is 0.01, and the
odds-ratios at two loci were  . (C) The
power of the test statistic
. (C) The
power of the test statistic  , the
“fast-epistasis” in PLINK and logistic regression analysis
for testing interaction between two linked loci as a function of
traditional odds-ratio
, the
“fast-epistasis” in PLINK and logistic regression analysis
for testing interaction between two linked loci as a function of
traditional odds-ratio  under a
two-locus recessive
under a
two-locus recessive recessive
disease model, where the number of individuals in both the case and
control groups is 2,000, the significance level is 0.001, and the
odds-ratios at two loci were
recessive
disease model, where the number of individuals in both the case and
control groups is 2,000, the significance level is 0.001, and the
odds-ratios at two loci were  .
.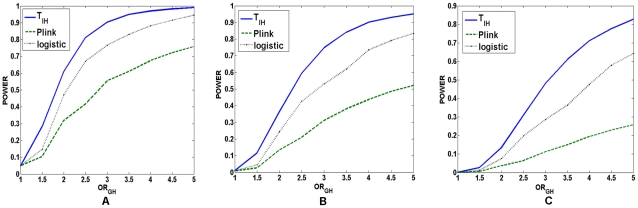
 , the
“fast-epistasis” in PLINK and logistic regression analysis
for testing interaction between two linked loci as a function of
traditional odds-ratio
, the
“fast-epistasis” in PLINK and logistic regression analysis
for testing interaction between two linked loci as a function of
traditional odds-ratio  under a
two-locus dominant
under a
two-locus dominant dominant
disease model, where the number of individuals in both the case and
control groups is 1,000, the significance level is 0.05, and the
odds-ratios at two loci were
dominant
disease model, where the number of individuals in both the case and
control groups is 1,000, the significance level is 0.05, and the
odds-ratios at two loci were  . (B) The
power of the test statistic
. (B) The
power of the test statistic  , the
“fast-epistasis” in PLINK and logistic regression analysis
for testing interaction between two linked loci as a function of
traditional odds-ratio
, the
“fast-epistasis” in PLINK and logistic regression analysis
for testing interaction between two linked loci as a function of
traditional odds-ratio  under a
two-locus dominant
under a
two-locus dominant dominant
disease model, where the number of individuals in both the case and
control groups is 1,000, the significance level is 0.01, and the
odds-ratios at two loci were
dominant
disease model, where the number of individuals in both the case and
control groups is 1,000, the significance level is 0.01, and the
odds-ratios at two loci were  . (C) The
power of the test statistic
. (C) The
power of the test statistic  , the
“fast-epistasis” in PLINK and logistic regression analysis
for testing interaction between two linked loci as a function of
traditional odds-ratio
, the
“fast-epistasis” in PLINK and logistic regression analysis
for testing interaction between two linked loci as a function of
traditional odds-ratio  under a
two-locus dominant
under a
two-locus dominant dominant
disease model, where the number of individuals in both the case and
control groups is 1,000, the significance level is 0.001, and the
odds-ratios at two loci were
dominant
disease model, where the number of individuals in both the case and
control groups is 1,000, the significance level is 0.001, and the
odds-ratios at two loci were  .
.
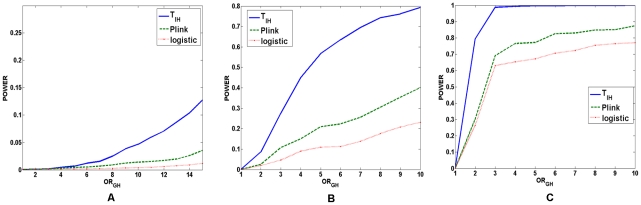
 , the
“fast-epistasis” in PLINK and logistic regression for
testing interaction between two linked loci analysis as a function of
traditional odds-ratio
, the
“fast-epistasis” in PLINK and logistic regression for
testing interaction between two linked loci analysis as a function of
traditional odds-ratio  under a
two-locus additive
under a
two-locus additive additive
disease model, where the number of individuals in both the case and
control groups is 1,000, the significance level is 0.05, and the
odds-ratios at two loci were
additive
disease model, where the number of individuals in both the case and
control groups is 1,000, the significance level is 0.05, and the
odds-ratios at two loci were  . (B) The
power of the test statistic
. (B) The
power of the test statistic  , the
“fast-epistasis” in PLINK and logistic regression for
testing interaction between two linked loci analysis as a function of
traditional odds-ratio
, the
“fast-epistasis” in PLINK and logistic regression for
testing interaction between two linked loci analysis as a function of
traditional odds-ratio  under a
two-locus additive
under a
two-locus additive additive
disease model, where the number of individuals in both the case and
control groups is 1,000, the significance level is 0.01, and the
odds-ratios at two loci were
additive
disease model, where the number of individuals in both the case and
control groups is 1,000, the significance level is 0.01, and the
odds-ratios at two loci were  . (C) The
power of the test statistic
. (C) The
power of the test statistic  , the
“fast-epistasis” in PLINK and logistic regression for
testing interaction between two linked loci analysis as a function of
traditional odds-ratio
, the
“fast-epistasis” in PLINK and logistic regression for
testing interaction between two linked loci analysis as a function of
traditional odds-ratio  under a
two-locus additive
under a
two-locus additive additive
disease model, where the number of individuals in both the case and
control groups is 1,000, the significance level is 0.001, and the
odds-ratios at two loci were
additive
disease model, where the number of individuals in both the case and
control groups is 1,000, the significance level is 0.001, and the
odds-ratios at two loci were  .
.
 , the
“fast-epistasis” in PLINK and logistic regression analysis
for testing interaction between two unlinked loci as a function of
traditional odds-ratio
, the
“fast-epistasis” in PLINK and logistic regression analysis
for testing interaction between two unlinked loci as a function of
traditional odds-ratio  under a
two-locus recessive
under a
two-locus recessive recessive
disease model, where the number of individuals in both the case and
control groups is 2,000, the significance level is 0.001, and the
odds-ratios at two loci were
recessive
disease model, where the number of individuals in both the case and
control groups is 2,000, the significance level is 0.001, and the
odds-ratios at two loci were  . (B) The
power of the test statistic
. (B) The
power of the test statistic  , the
“fast-epistasis” in PLINK and logistic regression analysis
for testing interaction between two unlinked loci as a function of
traditional odds-ratio
, the
“fast-epistasis” in PLINK and logistic regression analysis
for testing interaction between two unlinked loci as a function of
traditional odds-ratio  under a
two-locus dominant
under a
two-locus dominant dominant
disease model, where the number of individuals in both the case and
control groups is 1,000, the significance level is 0.001, and the
odds-ratios at two loci were
dominant
disease model, where the number of individuals in both the case and
control groups is 1,000, the significance level is 0.001, and the
odds-ratios at two loci were  . (C) The
power of the test statistic
. (C) The
power of the test statistic  , the
“fast-epistasis” in PLINK and logistic regression analysis
for testing interaction between two unlinked loci as a function of
traditional odds-ratio
, the
“fast-epistasis” in PLINK and logistic regression analysis
for testing interaction between two unlinked loci as a function of
traditional odds-ratio  under a
two-locus additive
under a
two-locus additive additive
disease model, where the number of individuals in both the case and
control groups is 1,000, the significance level is 0.001, and the
odds-ratios at two loci were
additive
disease model, where the number of individuals in both the case and
control groups is 1,000, the significance level is 0.001, and the
odds-ratios at two loci were  .
.
Comment in
-
Improved statistics for genome-wide interaction analysis.PLoS Genet. 2012;8(4):e1002625. doi: 10.1371/journal.pgen.1002625. Epub 2012 Apr 5. PLoS Genet. 2012. PMID: 22496670 Free PMC article.
References
Publication types
MeSH terms
Substances
Grants and funding
LinkOut - more resources
Full Text Sources
