

Increased Plp1 gene expression leads to massive microglial cell activation and inflammation throughout the brain
- PMID: 20885931
- PMCID: PMC2946597
- DOI: 10.1042/AN20100016
Increased Plp1 gene expression leads to massive microglial cell activation and inflammation throughout the brain
Abstract
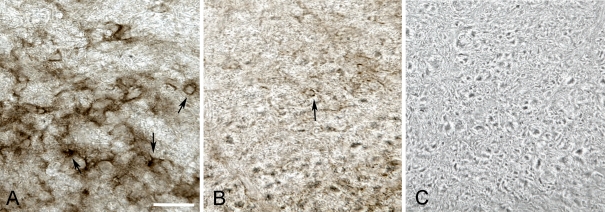
PMD (Pelizaeus-Merzbacher disease) is a rare neurodegenerative disorder that impairs motor and cognitive functions and is associated with a shortened lifespan. The cause of PMD is mutations of the PLP1 [proteolipid protein 1 gene (human)] gene. Transgenic mice with increased Plp1 [proteolipid protein 1 gene (non-human)] copy number model most aspects of PMD patients with duplications. Hypomyelination and demyelination are believed to cause the neurological abnormalities in mammals with PLP1 duplications. We show, for the first time, intense microglial reactivity throughout the grey and white matter of a transgenic mouse line with increased copy number of the native Plp1 gene. Activated microglia in the white and grey matter of transgenic mice are found as early as postnatal day 7, before myelin commences in normal cerebra. This finding indicates that degeneration of myelin does not cause the microglial response. Microglial numbers are doubled due to in situ proliferation. Compared with the jp (jimpy) mouse, which has much more oligodendrocyte death and hardly any myelin, microglia in the overexpressors show a more dramatic microglial reactivity than jp, especially in the grey matter. Predictably, many classical markers of an inflammatory response, including TNF-α (tumour necrosis factor-α) and IL-6, are significantly up-regulated manyfold. Because inflammation is believed to contribute to axonal degeneration in multiple sclerosis and other neurodegenerative diseases, inflammation in mammals with increased Plp1 gene dosage may also contribute to axonal degeneration described in patients and rodents with PLP1 increased gene dosage.
Keywords: BrdU, bromodeoxyuridine; CCL3, CC chemokine ligand 3; CCR1, CC chemokine receptor 1; CD11b, cluster of differentiation molecule 11B; CD8, cluster of differentiation 8; CNS, central nervous system; CRP, C-reactive protein; CXCL, CXC chemokine ligand; DAB, diaminobenzidine; DPN, day postnatal; EAE, experimental allergic encephalomyelitis; GAPDH, glyceraldehyde-3-phosphate dehydrogenase; HRP, horseradish peroxidase; IL-1β, interleukin-1β; Iba1, ionized calcium-binding adaptor molecule 1; MOG, myelin oligodendrocyte glycoprotein; PLP1, proteolipid protein 1 gene (human); PMD, Pelizaeus–Merzbacher disease; Pelizaeus–Merzbacher disease; Plp1, proteolipid protein 1 gene (non-human); QPCR, quantitative PCR; TNF-α, tumour necrosis factor-α; Ta, Tabby; iNOS, inducible nitric oxide synthase; inflammation; jp, jimpy; microglia; myelin; oligodendrocyte; proteolipid protein; qRT–PCR, quantitative reverse transcription–PCR.
Figures


Similar articles
-
Clinically relevant intronic splicing enhancer mutation in myelin proteolipid protein leads to progressive microglia and astrocyte activation in white and gray matter regions of the brain.J Neuroinflammation. 2013 Dec 5;10:146. doi: 10.1186/1742-2094-10-146. J Neuroinflammation. 2013. PMID: 24314267 Free PMC article.
-
Suppression of proteolipid protein rescues Pelizaeus-Merzbacher disease.Nature. 2020 Sep;585(7825):397-403. doi: 10.1038/s41586-020-2494-3. Epub 2020 Jul 1. Nature. 2020. PMID: 32610343 Free PMC article.
-
Insertion of proteolipid protein into oligodendrocyte mitochondria regulates extracellular pH and adenosine triphosphate.Glia. 2014 Mar;62(3):356-73. doi: 10.1002/glia.22591. Epub 2013 Dec 31. Glia. 2014. PMID: 24382809 Free PMC article.
-
The molecular and cellular defects underlying Pelizaeus-Merzbacher disease.Expert Rev Mol Med. 2008 May 19;10:e14. doi: 10.1017/S1462399408000677. Expert Rev Mol Med. 2008. PMID: 18485258 Review.
-
Is involvement of inflammation underestimated in Pelizaeus-Merzbacher disease?J Neurosci Res. 2016 Dec;94(12):1572-1578. doi: 10.1002/jnr.23931. Epub 2016 Sep 23. J Neurosci Res. 2016. PMID: 27661457 Review.
Cited by
-
Pathology of the neurovascular unit in leukodystrophies.Acta Neuropathol Commun. 2021 Jun 3;9(1):103. doi: 10.1186/s40478-021-01206-6. Acta Neuropathol Commun. 2021. PMID: 34082828 Free PMC article.
-
The wmN1 Enhancer Region of the Mouse Myelin Proteolipid Protein Gene (mPlp1) is Indispensable for Expression of an mPlp1-lacZ Transgene in Both the CNS and PNS.Neurochem Res. 2020 Mar;45(3):663-671. doi: 10.1007/s11064-019-02919-w. Epub 2019 Nov 28. Neurochem Res. 2020. PMID: 31782102 Free PMC article.
-
Potential For Cell-mediated Immune Responses In Mouse Models Of Pelizaeus-Merzbacher Disease.Brain Sci. 2013 Dec 1;3(4):1417-44. doi: 10.3390/brainsci3041417. Brain Sci. 2013. PMID: 24575297 Free PMC article.
-
Activated immune response in an inherited leukodystrophy disease caused by the loss of oligodendrocyte gap junctions.Neurobiol Dis. 2015 Oct;82:86-98. doi: 10.1016/j.nbd.2015.05.018. Epub 2015 Jun 4. Neurobiol Dis. 2015. PMID: 26051537 Free PMC article.
-
Innovative mouse model mimicking human-like features of spinal cord injury: efficacy of Docosahexaenoic acid on acute and chronic phases.Sci Rep. 2019 Jun 20;9(1):8883. doi: 10.1038/s41598-019-45037-x. Sci Rep. 2019. PMID: 31222077 Free PMC article.
References
-
- Anderson TJ, Schneider A, Barrie JA, Klugmann M, McCulloch MC, Kirkham D, Kyriakides E, Nave KA, Griffiths IR. Late-onset neurodegeneration in mice with increased dosage of the proteolipid protein gene. J Comp Neurol. 1998;394:506–519. - PubMed
-
- Anderson TJ, Klugmann M, Thomson CE, Schneider A, Readhead C, Nave KA, Griffiths IR. Distinct phenotypes associated with increasing dosage of the PLP gene: implications for CMT1A due to PMP22 gene duplication. Ann NY Acad Sci. 1999;883:234–246. - PubMed
-
- Baraczka K, Nékám K, Pozsonyi T, Szüts I, Ormos G. Investigation of cytokine (tumor necrosis factor alpha, interleukin-6, interleukin-10) concentrations in the cerebrospinal fluid of female patients with multiple sclerosis and systemic lupus erythematosus. Eur J Neurol. 2004;11:37–42. - PubMed
-
- Barone FC, Arvin B, White RF, Miller A, Webb CL, Willette RN, Lysko PG, Feuerstein GZ. Tumor necrosis factor-alpha. A mediator of focal ischemic brain injury. Stroke. 1997;28:1233–1244. - PubMed
-
- Bessert DA, Skoff RP. High-resolution in situ hybridization and TUNEL staining with free-floating brain sections. J Histochem Cytochem. 1999;47:693–702. - PubMed
Publication types
MeSH terms
Substances
Grants and funding
LinkOut - more resources
Full Text Sources
Other Literature Sources
Research Materials
Miscellaneous