

Toll-like receptor 2 signaling protects mice from tumor development in a mouse model of colitis-induced cancer
- PMID: 20885960
- PMCID: PMC2946405
- DOI: 10.1371/journal.pone.0013027
Toll-like receptor 2 signaling protects mice from tumor development in a mouse model of colitis-induced cancer
Abstract
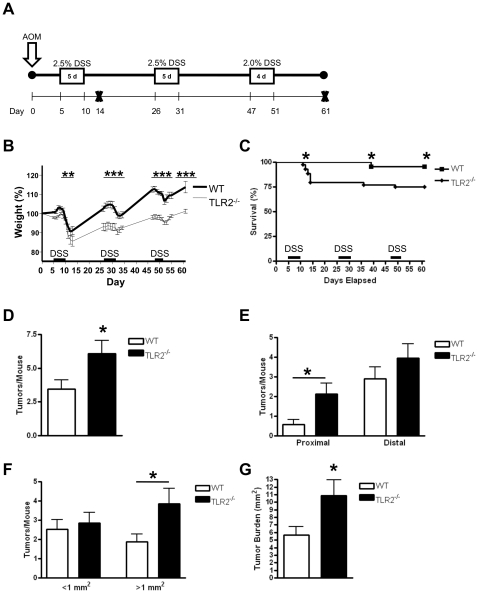
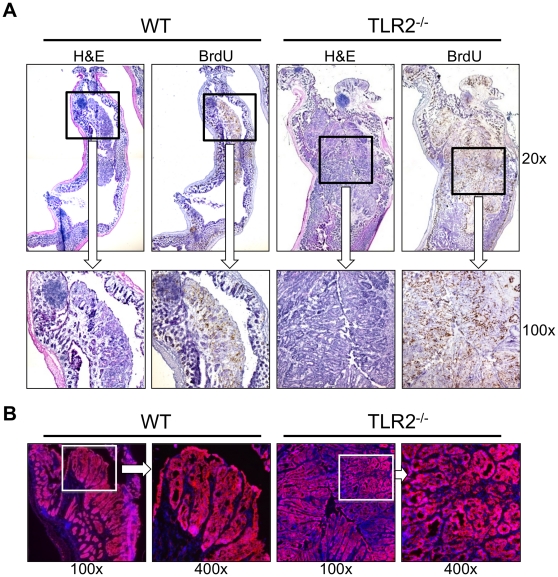
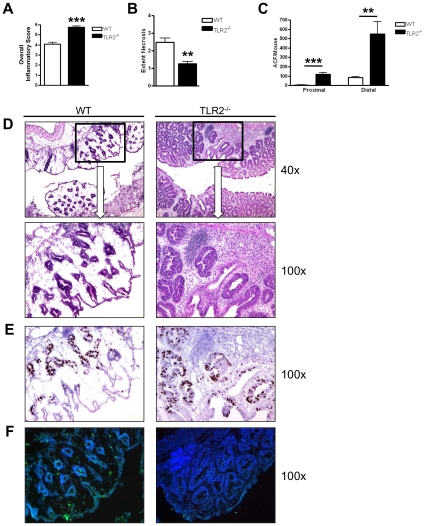
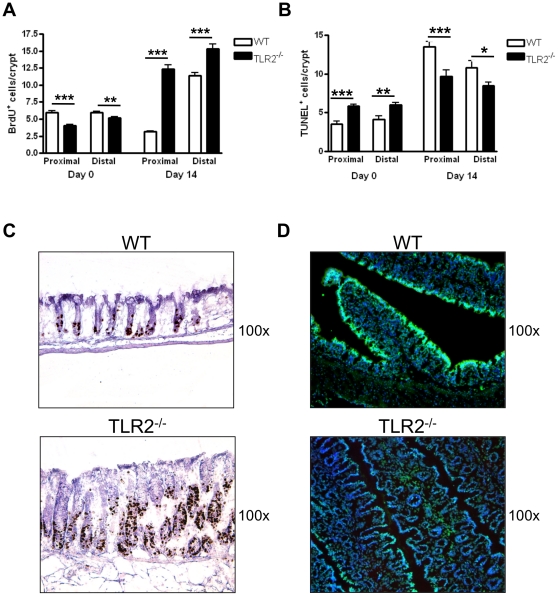
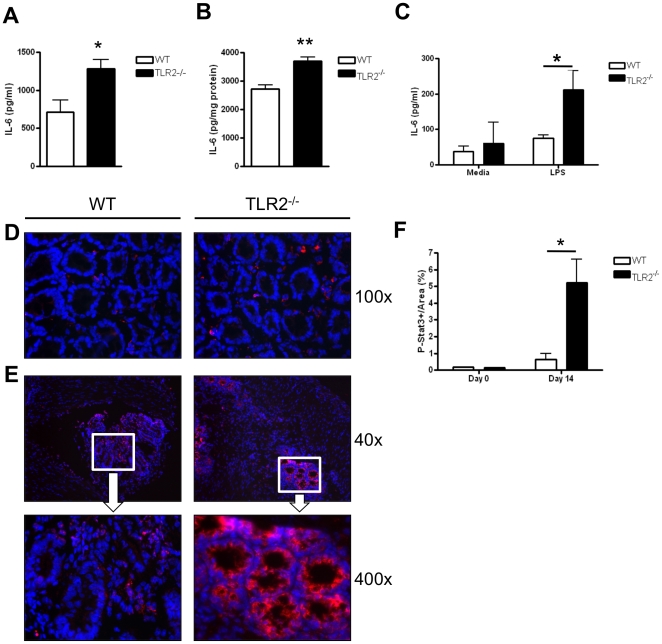
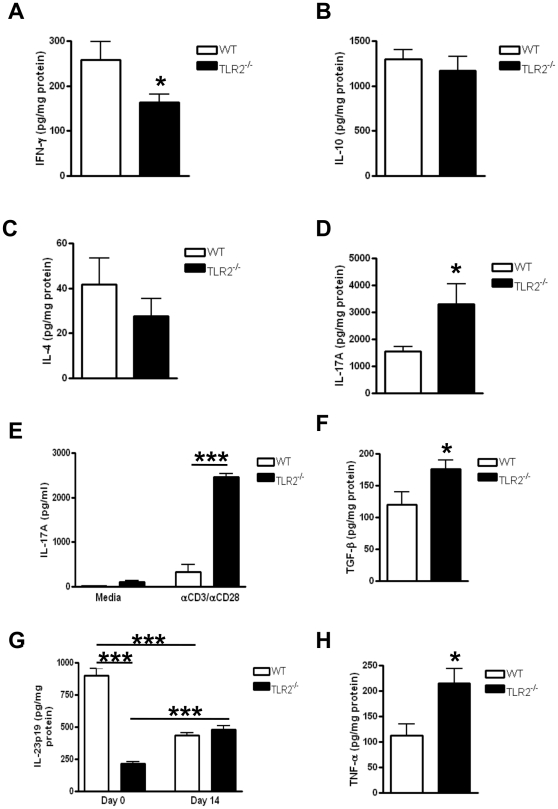
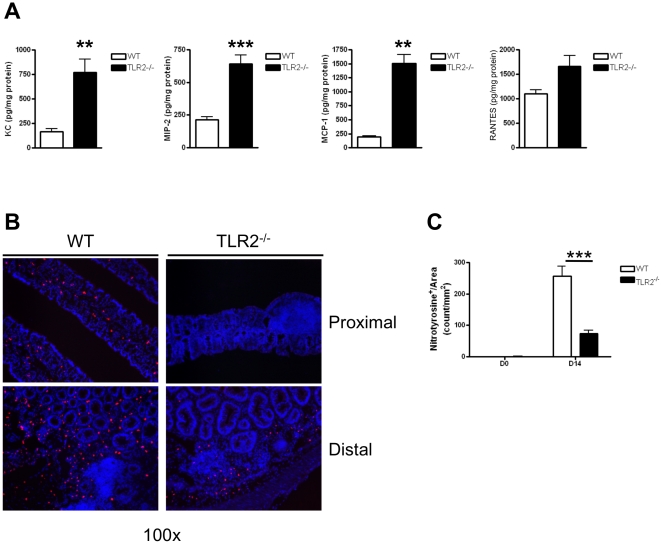
Inflammatory bowel disease (IBD) is a disorder of chronic inflammation with increased susceptibility to colorectal cancer. The etiology of IBD is unclear but thought to result from a dysregulated adaptive and innate immune response to microbial products in a genetically susceptible host. Toll-like receptor (TLR) signaling induced by intestinal commensal bacteria plays a crucial role in maintaining intestinal homeostasis, innate immunity and the enhancement of intestinal epithelial cell (IEC) integrity. However, the role of TLR2 in the development of colorectal cancer has not been studied. We utilized the AOM-DSS model for colitis-associated colorectal cancer (CAC) in wild type (WT) and TLR2(-/-) mice. Colons harvested from WT and TLR2(-/-) mice were used for histopathology, immunohistochemistry, immunofluorescence and cytokine analysis. Mice deficient in TLR2 developed significantly more and larger colorectal tumors than their WT controls. We provide evidence that colonic epithelium of TLR2(-/-) mice have altered immune responses and dysregulated proliferation under steady-state conditions and during colitis, which lead to inflammatory growth signals and predisposition to accelerated neoplastic growth. At the earliest time-points assessed, TLR2(-/-) colons exhibited a significant increase in aberrant crypt foci (ACF), resulting in tumors that developed earlier and grew larger. In addition, the intestinal microenvironment revealed significantly higher levels of IL-6 and IL-17A concomitant with increased phospho-STAT3 within ACF. These observations indicate that in colitis, TLR2 plays a protective role against the development of CAC.
Conflict of interest statement
Figures
Similar articles
-
TLR2 and interleukin-10 are involved in Bacteroides fragilis-mediated prevention of DSS-induced colitis in gnotobiotic mice.PLoS One. 2017 Jul 6;12(7):e0180025. doi: 10.1371/journal.pone.0180025. eCollection 2017. PLoS One. 2017. PMID: 28683149 Free PMC article.
-
MyD88 adaptor-like (Mal) regulates intestinal homeostasis and colitis-associated colorectal cancer in mice.Am J Physiol Gastrointest Liver Physiol. 2014 May 1;306(9):G769-78. doi: 10.1152/ajpgi.00399.2013. Epub 2014 Mar 6. Am J Physiol Gastrointest Liver Physiol. 2014. PMID: 24603458
-
Loss of Toll-like receptor 2 and 4 leads to differential induction of endoplasmic reticulum stress and proapoptotic responses in the intestinal epithelium under conditions of chronic inflammation.J Proteome Res. 2009 Oct;8(10):4406-17. doi: 10.1021/pr9000465. J Proteome Res. 2009. PMID: 19681597
-
Barrier-protective function of intestinal epithelial Toll-like receptor 2.Mucosal Immunol. 2008 Nov;1 Suppl 1:S62-6. doi: 10.1038/mi.2008.47. Mucosal Immunol. 2008. PMID: 19079234 Review.
-
Colon epithelial proliferation and carcinogenesis in diet-induced obesity.J Gastroenterol Hepatol. 2013 Dec;28 Suppl 4:41-7. doi: 10.1111/jgh.12240. J Gastroenterol Hepatol. 2013. PMID: 24251703 Review.
Cited by
-
Investigation of Toll-like Receptor-2, -3 and -4 Gene Expressions in Larynx Squamous Cell Carcinoma.Turk Arch Otorhinolaryngol. 2022 Sep;60(3):121-127. doi: 10.4274/tao.2022.2022-6-17. Epub 2022 Nov 15. Turk Arch Otorhinolaryngol. 2022. PMID: 36452243 Free PMC article.
-
Inflammation-Related Carcinogenesis: Lessons from Animal Models to Clinical Aspects.Cancers (Basel). 2021 Feb 22;13(4):921. doi: 10.3390/cancers13040921. Cancers (Basel). 2021. PMID: 33671768 Free PMC article. Review.
-
Systematic Profiling of Alternative Splicing for Sarcoma Patients Reveals Novel Prognostic Biomarkers Associated with Tumor Microenvironment and Immune Cells.Med Sci Monit. 2020 Jul 19;26:e924126. doi: 10.12659/MSM.924126. Med Sci Monit. 2020. PMID: 32683393 Free PMC article.
-
Mesenchymal Stem Cell Administration Attenuates Colon Cancer Progression by Modulating the Immune Component within the Colorectal Tumor Microenvironment.Stem Cells Transl Med. 2019 Mar;8(3):285-300. doi: 10.1002/sctm.18-0117. Epub 2018 Nov 19. Stem Cells Transl Med. 2019. PMID: 30451398 Free PMC article.
-
Evaluation of the detection of Toll-like receptors (TLRs) in cancer development and progression in patients with colorectal cancer.PLoS One. 2018 Jun 8;13(6):e0197327. doi: 10.1371/journal.pone.0197327. eCollection 2018. PLoS One. 2018. PMID: 29883450 Free PMC article.
References
-
- Baumgart D, Carding S. Inflammatory bowel disease: cause and immunobiology. Lancet. 2007;369:1627–1640. - PubMed
-
- Clevers H. At the crossroads of inflammation and cancer. Cell. 2004;118:671–674. - PubMed
-
- Xiao H, Gulen M, Qin J, Yao J, Bulek K, et al. The Toll-interleukin-1 receptor member SIGIRR regulates colonic epithelial homeostasis, inflammation, and tumorigenesis. Immunity. 2007;26:461–475. - PubMed
Publication types
MeSH terms
Substances
Grants and funding
LinkOut - more resources
Full Text Sources
Medical
Molecular Biology Databases
Miscellaneous
