

A stem cell-based tool for small molecule screening in adipogenesis
- PMID: 20885962
- PMCID: PMC2946407
- DOI: 10.1371/journal.pone.0013014
A stem cell-based tool for small molecule screening in adipogenesis
Abstract
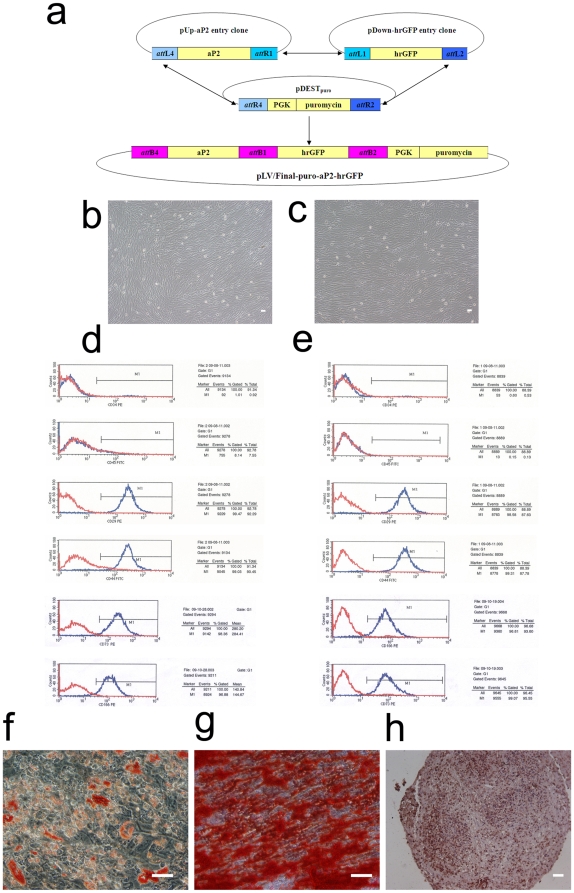
Techniques for small molecule screening are widely used in biological mechanism study and drug discovery. Here, we reported a novel adipocyte differentiation assay for small molecule selection, based on human mesenchymal stem cells (hMSCs) transduced with fluorescence reporter gene driven by adipogenic specific promoter--adipocyte Protein 2 (aP2; also namely Fatty Acid Binding Protein 4, FABP4). During normal adipogenic induction as well as adipogenic inhibition by Ly294002, we confirmed that the intensity of green fluorescence protein corresponded well to the expression level of aP2 gene. Furthermore, this variation of green fluorescence protein intensity can be read simply through fluorescence spectrophotometer. By testing another two small molecules in adipogenesis--Troglitazone and CHIR99021, we proved that this is a simple and sensitive method, which could be applied in adipocyte biology, drug discovery and toxicological study in the future.
Conflict of interest statement
Figures


Similar articles
-
KD025 (SLx-2119) suppresses adipogenesis at intermediate stage in human adipose-derived stem cells.Adipocyte. 2019 Dec;8(1):114-124. doi: 10.1080/21623945.2019.1590929. Epub 2019 Mar 23. Adipocyte. 2019. PMID: 30860936 Free PMC article.
-
Effect of ceramide on mesenchymal stem cell differentiation toward adipocytes.Appl Biochem Biotechnol. 2010 Jan;160(1):197-212. doi: 10.1007/s12010-008-8505-8. Epub 2009 Jan 23. Appl Biochem Biotechnol. 2010. PMID: 19165630
-
Rosiglitazone stimulates adipogenesis and decreases osteoblastogenesis in human mesenchymal stem cells.J Endocrinol Invest. 2007 Oct;30(9):RC26-30. doi: 10.1007/BF03350807. J Endocrinol Invest. 2007. PMID: 17993761
-
miR-431 inhibits adipogenic differentiation of human bone marrow-derived mesenchymal stem cells via targeting insulin receptor substance 2.Stem Cell Res Ther. 2018 Aug 30;9(1):231. doi: 10.1186/s13287-018-0980-4. Stem Cell Res Ther. 2018. PMID: 30165902 Free PMC article.
-
Inhibition of Adipogenic Differentiation of Human Bone Marrow-Derived Mesenchymal Stem Cells by a Phytoestrogen Diarylheptanoid from Curcuma comosa.J Agric Food Chem. 2020 Sep 16;68(37):9993-10002. doi: 10.1021/acs.jafc.0c04063. Epub 2020 Sep 4. J Agric Food Chem. 2020. PMID: 32838526
Cited by
-
An engineered approach to stem cell culture: automating the decision process for real-time adaptive subculture of stem cells.PLoS One. 2011;6(11):e27672. doi: 10.1371/journal.pone.0027672. Epub 2011 Nov 16. PLoS One. 2011. PMID: 22110715 Free PMC article.
-
High-throughput, nonperturbing quantification of lipid droplets with digital holographic microscopy.J Lipid Res. 2018 Jul;59(7):1301-1310. doi: 10.1194/jlr.D085217. Epub 2018 Apr 5. J Lipid Res. 2018. PMID: 29622579 Free PMC article.
-
MicroRNAs as novel regulators of stem cell fate.World J Stem Cells. 2013 Oct 26;5(4):172-87. doi: 10.4252/wjsc.v5.i4.172. World J Stem Cells. 2013. PMID: 24179605 Free PMC article. Review.
-
Pyrintegrin Induces Soft Tissue Formation by Transplanted or Endogenous Cells.Sci Rep. 2017 Jan 27;7:36402. doi: 10.1038/srep36402. Sci Rep. 2017. PMID: 28128224 Free PMC article.
-
Therapeutic Potential of Differentiated Mesenchymal Stem Cells for Treatment of Osteoarthritis.Int J Mol Sci. 2015 Jul 2;16(7):14961-78. doi: 10.3390/ijms160714961. Int J Mol Sci. 2015. PMID: 26147426 Free PMC article. Review.
References
-
- Trayhurn P. Endocrine and signalling role of adipose tissue: new perspectives on fat. Acta Physiol Scand. 2005;184:285–293. - PubMed
-
- Haffner SM. Abdominal adiposity and cardiometabolic risk: do we have all the answers? Am J Med. 2007;120:S10–16; discussion S16–17. - PubMed
-
- Kahn SE, Hull RL, Utzschneider KM. Mechanisms linking obesity to insulin resistance and type 2 diabetes. Nature. 2006;444:840–846. - PubMed
-
- Lehrke M, Lazar MA. The many faces of PPARgamma. Cell. 2005;123:993–999. - PubMed
Publication types
MeSH terms
Substances
LinkOut - more resources
Full Text Sources
Research Materials
