. 2010 Sep 23;5(9):e12925.
doi: 10.1371/journal.pone.0012925.

1,25-Dihydroxyvitamin D3 inhibits the differentiation and migration of T(H)17 cells to protect against experimental autoimmune encephalomyelitis

Affiliations

1,25-Dihydroxyvitamin D3 inhibits the differentiation and migration of T(H)17 cells to protect against experimental autoimmune encephalomyelitis

Jae-Hoon Chang et al. PLoS One. .

Erratum in

  • PLoS One. 2010;5(12) doi: 10.1371/annotation/6da7b65e-dda2-467d-bcb3-82d5669f6bc6

Abstract

Background: Vitamin D(3), the most physiologically relevant form of vitamin D, is an essential organic compound that has been shown to have a crucial effect on the immune responses. Vitamin D(3) ameliorates the onset of the experimental autoimmune encephalomyelitis (EAE); however, the direct effect of vitamin D(3) on T cells is largely unknown.

Methodology/principal findings: In an in vitro system using cells from mice, the active form of vitamin D(3) (1,25-dihydroxyvitamin D(3)) suppresses both interleukin (IL)-17-producing T cells (T(H)17) and regulatory T cells (Treg) differentiation via a vitamin D receptor signal. The ability of 1,25-dihydroxyvitamin D(3) (1,25(OH)(2)D(3)) to reduce the amount of IL-2 regulates the generation of Treg cells, but not T(H)17 cells. Under T(H)17-polarizing conditions, 1,25(OH)(2)D(3) helps to increase the numbers of IL-10-producing T cells, but 1,25(OH)(2)D(3)'s negative regulation of T(H)17 development is still defined in the IL-10(-/-) T cells. Although the STAT1 signal reciprocally affects the secretion of IL-10 and IL-17, 1,25(OH)(2)D(3) inhibits IL-17 production in STAT1(-/-) T cells. Most interestingly, 1,25(OH)(2)D(3) negatively regulates CCR6 expression which might be essential for T(H)17 cells to enter the central nervous system and initiate EAE.

Conclusions/significance: Our present results in an experimental murine model suggest that 1,25(OH)(2)D(3) can directly regulate T cell differentiation and could be applied in preventive and therapeutic strategies for T(H)17-mediated autoimmune diseases.


Conflict of interest statement

Competing Interests: The authors have declared that no competing interests exist.

Figures

Figure 1
Figure 1. 1,25(OH)2D3 inhibits the onset of EAE and modulates the composition of TH cells.
(A) Disease scores are shown for EAE in B6 mice at various time points after subcutaneous immunization with MOG35–55 peptide in CFA and pertussis toxin. Results shown are mean ± SD. **p<0.01, ***p<0.001, compared with EAE-PBS group. (B) At 20 days after challenge, total mononuclear cells obtained from the brains of MOG35–55-immunized wild-type mice and vitamin D3-treated mice and stained with anti-CD4 and anti-CD3 Abs. Data are representative of three independent experiments with at least five mice per group. ***p<0.001, compared with EAE-PBS group. (C) Mononuclear cells from brains or splenocytes were restimulated in vitro with PMA/ionomycin for 5 hr, then stained intracellularly for Foxp3, IL-17A, IL-10, and IFN-γ. Data are representative of three independent experiments with at least five mice per group. *p<0.05, compared with splenocytes of EAE-PBS group.
Figure 2
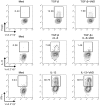
Figure 2. 1,25(OH)2D3 negatively regulates Treg and TH17 induction in neuro-antigen-specific CD4+ T cells.
CD4+ T cells isolated from MOG TCR-Tg mice (Vα3.2 and Vβ11 TCR, B6 background) were cultured with MOG35–55 peptide (25 µg/ml) in the presence of CD3+ T cell-depleted splenocytes for 4 days under Treg-polarizing conditions (rTGF-β, 1 ng/ml; anti-IFN-γ, 10 µg/ml; and anti-IL-4, 10 µg/ml) or TH17-polarizing conditions (rTGF-β, 1 ng/ml; rIL-6, 20 ng/ml; anti-IFN-γ, 10 µg/ml; and anti-IL-4, 10 µg/ml) or TH1-polarizing conditions (rIL-12, 10 ng/ml; and anti-IL-4, 10 µg/ml) together with 1,25(OH)2D3 (VitD, 100 nM). Cells were then stained intracellularly for Foxp3, IL-17, or IFN-γ, respectively. The plots shown are gated on CD4+Vα3.2+ cells with quadrants drawn based on isotype controls. Data are representative of two independent experiments with at least three mice per group.
Figure 3
Figure 3. 1,25(OH)2D3 negatively regulates Treg and TH17 induction in OVA-specific CD4+ T cells.
(A) Naïve CD4+ T cells from Rag2−/− DO11.10 mice (BALB/c background) were cultured with 0.25 µM OVA323–339 peptide in the presence of CD3+ T cell-depleted splenocytes for 4 days under polarizing conditions (Treg, TH17, or TH1) together with retinoic acid (RA, 100 nM) or 1,25(OH)2D3 (VitD, 100 nM) as described for Figure 2. Then cells were stained intracellularly for Foxp3, IL-17, or IFN-γ, respectively. The plots shown are gated on CD4+KJ1-26+ cells with quadrants drawn based on isotype controls. The numbers in the quadrants indicate cell percentages (left). Means ± SD of triplicate samples are plotted (right). Data are representative of five independent experiments with at least three mice per group. **p<0.01 compared with each cytokine-alone group. (B) Expression of Foxp3 and IL-17 genes was analyzed by quantitative PCR. Data are representative of five independent experiments with at least three mice per group.
Figure 4
Figure 4. Vitamin D receptor on CD4+ T cells is required for regulation of Treg and TH17 differentiation by 1,25(OH)2D3.
Purified naïve CD4+ T cells from wild-type (WT) or VDR−/− (KO) mice of B6 background were cultured with APCs from WT or VDR−/− mice in the presence of 1 µg/ml anti-CD3 mAb for 4 days under Treg-polarizing conditions (rTGF-β, 1 ng/ml; anti-IFN-γ, 10 µg/ml; and anti-IL-4, 10 µg/ml) or TH17-polarizing conditions (rTGF-β, 1 ng/ml; rIL-6, 20 ng/ml; anti-IFN-γ, 10 µg/ml; and anti-IL-4, 10 µg/ml). (A) Foxp3 expression in gated CD3+CD4+ cells was analyzed by flow cytometry. (B) For the IL-17A staining, CD4+ T cells were restimulated with PMA/ionomycin for 5 hr. Numbers beside quadrants indicate percentages of positive cells in each quadrant. Data are representative of three independent experiments with at least three mice per group. ***p<0.001 compared with cytokine-alone group.
Figure 5
Figure 5. Exogenous IL-2 recovers the decreased Treg but not TH17 generation by 1,25(OH)2D3.
Naïve CD4+ T cells from Rag2−/− DO11.10 mice (BALB/c background) were cultured with 0.25 µM OVA323–339 peptide in the presence of CD3+ T cell-depleted splenocytes for 4 days. (A) Under Treg-polarizing conditions with 1,25(OH)2D3 (0.1, 1, 10, and 100 nM), culture supernatants were analyzed for IL-2 production by ELISA. (B) Under Treg-polarizing conditions, IL-2 cytokine was added in 1,25(OH)2D3-treated groups in a dose-dependent manner (IL-2: 0.1, 1, 10, and 20 ng/ml); 4 days later the CD4+ T cells were stained intracellularly for Foxp3. (C) Under TH17-polarizing conditions, 1,25(OH)2D3 (100 nM) and IL-2 (0.1, 1, 10, and 20 ng/ml) were added. The average frequency of IL-17A+ T cells in gated CD4+KJ1-26+ cells is shown. Means ± SD of triplicate samples are plotted. Data are representative of three independent experiments with at least three mice per group. *p<0.05, ***p<0.001 compared with cytokine-alone group.
Figure 6
Figure 6. 1,25(OH)2D3 and TGF-β plus IL-6 partially induce IL-10 production, but IL-10 is not involved in the inhibitory mechanism of vitamin D3.
(A and B) Naïve CD4+ T cells from Rag2−/− DO11.10 mice (BALB/c background) were cultured with OVA323–339 peptides in the presence of the indicated cytokines with and without 1,25(OH)2D3 (100 nM) for 4 days. The average frequency of IL-10-producing cells is shown. (C) The dose-dependent effect of IL-6 on IL-10 production in CD4+ T cells induced by TGF-β and 1,25(OH)2D3 was determined by titrated doses of IL-6 (0.1, 1, 10, and 100 ng/ml). (D) IL-10 production by CD4+ T cells cocultured with CD3-depleted splenocytes and OVA323–339 peptide was determined by titrated doses of 1,25(OH)2D3 (0.1, 1, 10, and 100 nM). (E) Average frequency of IL-10+cells among CD3+CD4+ cells as determined by flow cytometry after treatment with IL-27 and/or other indicated cytokines with or without 1,25(OH)2D3. Plots show mean ± SD of triplicate samples. *p<0.05, **p<0.01, ***p<0.001 compared with medium alone. (F) To analyze the effect of autocrine IL-10 on TH17 differentiation, we used IL-10−/− mice of C57BL/6 background. Naïve CD4+ T cells isolated from IL-10−/− or IL-10+/+ mice were stimulated with anti-CD3 mAb in the presence of the indicated condition for 4 days. IL-17 production in CD4+ T cells was analyzed by flow cytometry. Data are representative of three independent experiments with at least three mice per group.
Figure 7
Figure 7. The inhibitory mechanism of 1,25(OH)2D3 is independent of the STAT1 signal.
Naïve CD4+ T cells from STAT1+/+ and STAT1−/− mice (B6 background) were cultured with anti-CD3 Abs (1 µg/ml) in the presence of CD3-depleted splenocytes for 4 days under various cytokine treatment conditions (IL-27, 10 ng/ml; TGF-β, 1 ng/ml; IL-6, 20 ng/ml; anti-IFN-γ, 10 mg/ml; or anti-IL-4, 10 mg/ml) with 1,25(OH)2D3 (100 nM) and then stained intracellularly for IL-17A and IL-10. Data are representative of three independent experiments with at least three mice per group. **p<0.01 compared with cytokine-alone group.
Figure 8
Figure 8. 1,25(OH)2D3 inhibits the expression of the CCR6 molecule in activated T cells.
(A) Flow cytometry analysis of CCR6 expression on activated T cells under TH17-polarizing conditions (as described for Figure 2). Data are representative of three independent experiments with at least three mice per group. *p<0.05 compared with cytokine-alone group. (B) MIP-3α/CCL20 was added to the lower chamber and in vitro-generated TH17 cells were applied to the upper chamber well. Two hours later, cells in the lower chamber were counted. Plots are mean ± SD of triplicate samples. Data are representative of two independent experiments with at least three mice per group. **p<0.01.

References

    1. Bettelli E, Korn T, Oukka M, Kuchroo VK. Induction and effector functions of Th17 cells. Nature. 2008;453:1051–1057. - PMC - PubMed
    1. Dong C. Th17 cells in development: an updated view of their molecular identity and genetic programming. Nat Rev Immunol. 2008;8:337–348. - PubMed
    1. Weaver CT, Hatton RD, Mangan PR, Harrington LE. IL-17 family cytokines and the expanding diversity of effector T cell lineages. Annu Rev Immunol. 2007;25:821–852. - PubMed
    1. Gaffen SL. An overview of IL-17 function and signaling. Cytokine. 2008;43:402–407. - PMC - PubMed
    1. Noseworthy JH, Lucchinetti C, Rodriguez M, Weinshenker BG. Multiple sclerosis. N Engl J Med. 2000;343:938–952. - PubMed

Publication types

MeSH terms