

Inhibition of TIR domain signaling by TcpC: MyD88-dependent and independent effects on Escherichia coli virulence
- PMID: 20886104
- PMCID: PMC2944809
- DOI: 10.1371/journal.ppat.1001120
Inhibition of TIR domain signaling by TcpC: MyD88-dependent and independent effects on Escherichia coli virulence
Abstract
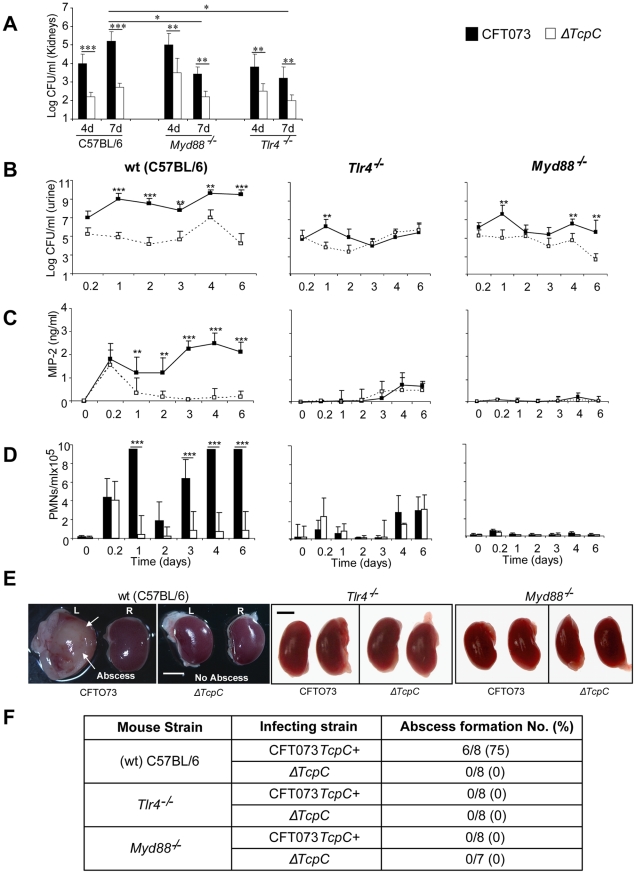
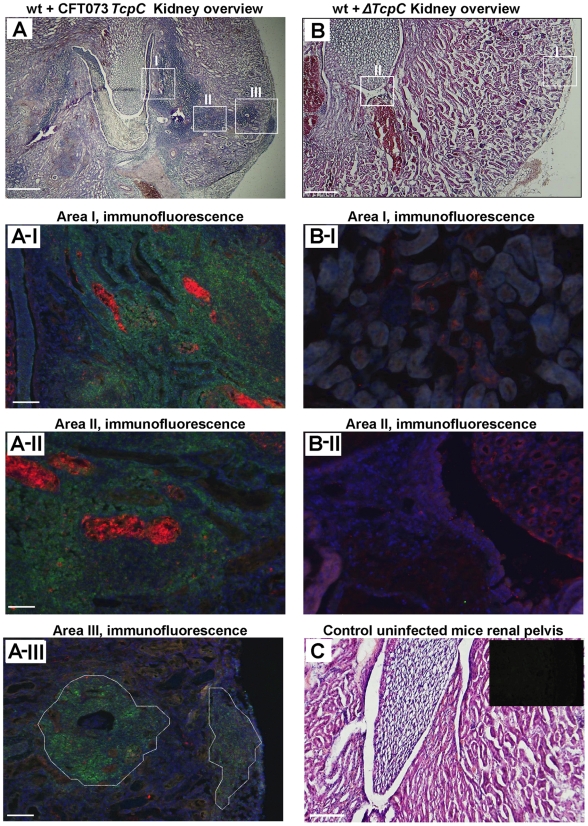
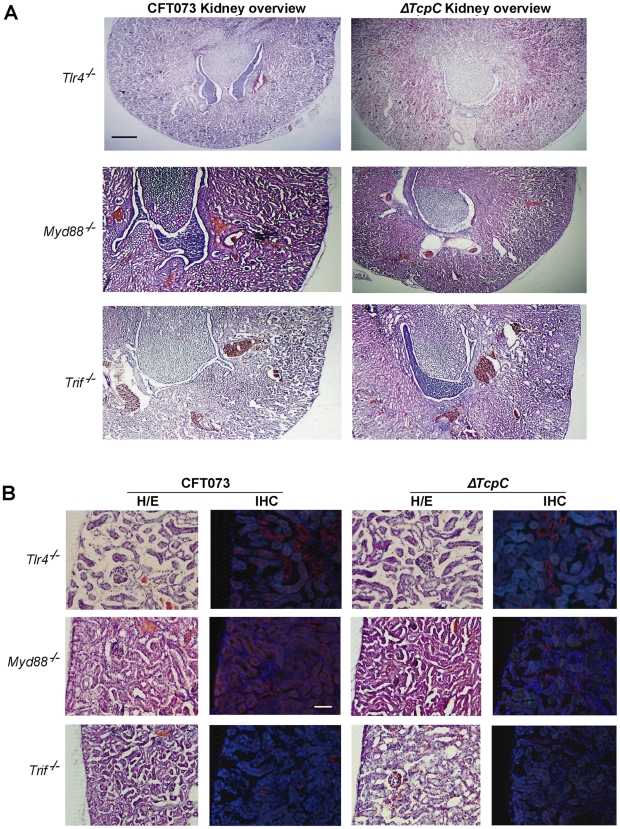
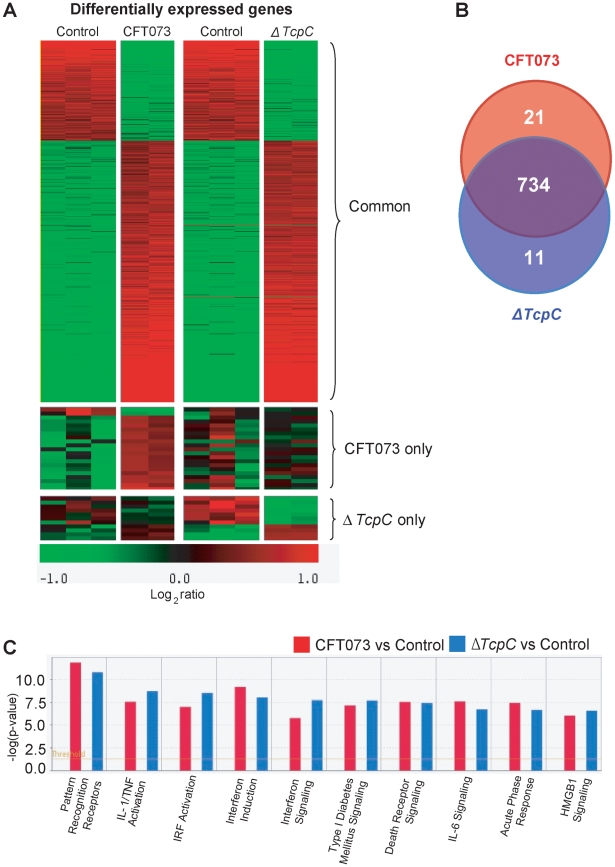
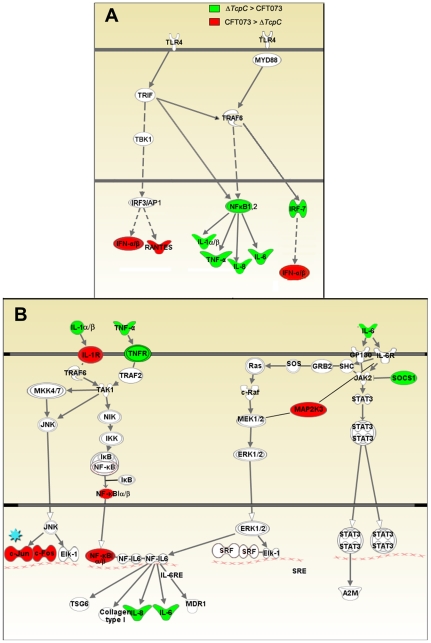
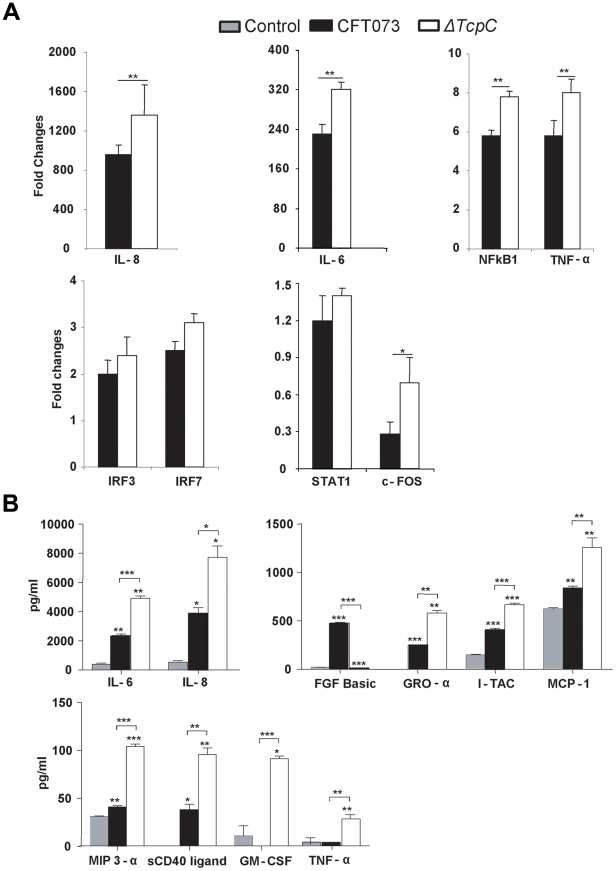
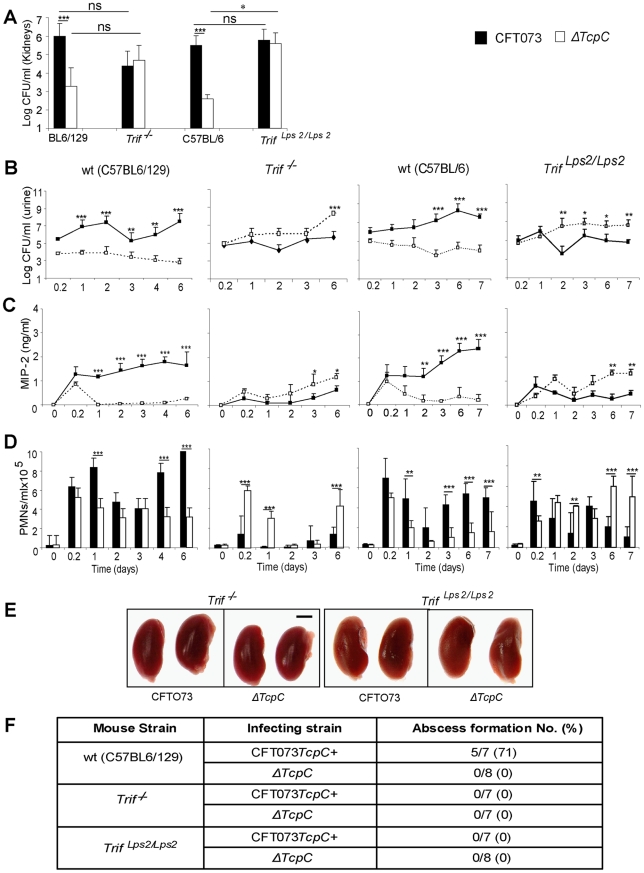
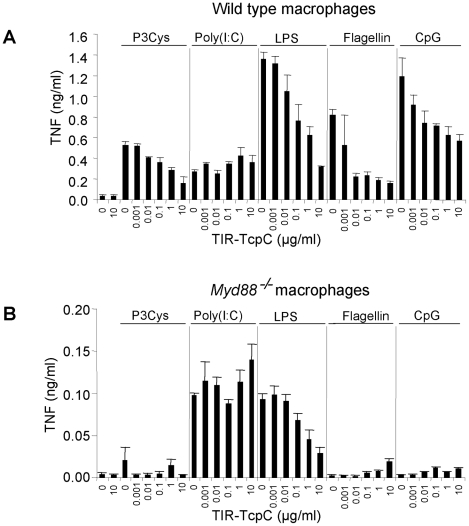
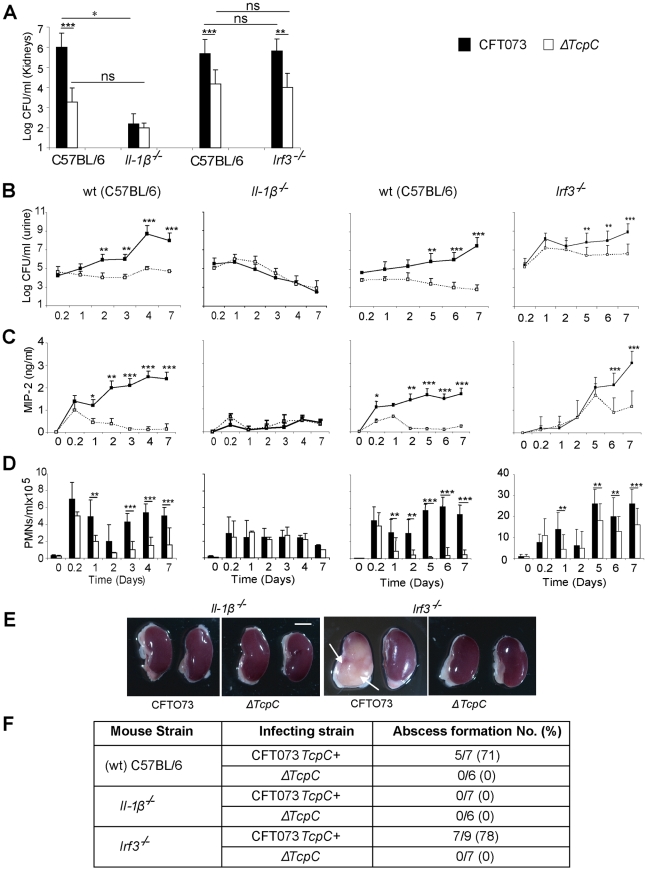
Toll-like receptor signaling requires functional Toll/interleukin-1 (IL-1) receptor (TIR) domains to activate innate immunity. By producing TIR homologous proteins, microbes inhibit host response induction and improve their own survival. The TIR homologous protein TcpC was recently identified as a virulence factor in uropathogenic Escherichia coli (E. coli), suppressing innate immunity by binding to MyD88. This study examined how the host MyD88 genotype modifies the in vivo effects of TcpC and whether additional, TIR-domain containing proteins might be targeted by TcpC. In wild type mice (wt), TcpC enhanced bacterial virulence, increased acute mortality, bacterial persistence and tissue damage after infection with E. coli CFT073 (TcpC+), compared to a ΔTcpC deletion mutant. These effects were attenuated in Myd88(-/-) and Tlr4(-/-) mice. Transcriptomic analysis confirmed that TcpC inhibits MYD88 dependent gene expression in CFT073 infected human uroepithelial cells but in addition the inhibitory effect included targets in the TRIF and IL-6/IL-1 signaling pathways, where MYD88 dependent and independent signaling may converge. The effects of TcpC on bacterial persistence were attenuated in Trif (-/-) or Il-1β (-/-) mice and innate immune responses to ΔTcpC were increased, confirming that Trif and Il-1β dependent targets might be involved in vivo, in addition to Myd88. Furthermore, soluble TcpC inhibited Myd88 and Trif dependent TLR signaling in murine macrophages. Our results suggest that TcpC may promote UTI-associated pathology broadly, through inhibition of TIR domain signaling and downstream pathways. Dysregulation of the host response by microbial TcpC thus appears to impair the protective effects of innate immunity, while promoting inflammation and tissue damage.
Conflict of interest statement
The authors have declared that no competing interests exist.
Figures
Similar articles
-
Toll/Interleukin-1 Receptor Domain Derived from TcpC (TIR-TcpC) Ameliorates Experimental Autoimmune Arthritis by Down-modulating Th17 Cell Response.J Biol Chem. 2016 Jun 3;291(23):12358-69. doi: 10.1074/jbc.M116.722801. Epub 2016 Mar 28. J Biol Chem. 2016. PMID: 27022030 Free PMC article.
-
Subversion of Toll-like receptor signaling by a unique family of bacterial Toll/interleukin-1 receptor domain-containing proteins.Nat Med. 2008 Apr;14(4):399-406. doi: 10.1038/nm1734. Epub 2008 Mar 9. Nat Med. 2008. PMID: 18327267
-
Molecular mechanisms for the subversion of MyD88 signaling by TcpC from virulent uropathogenic Escherichia coli.Proc Natl Acad Sci U S A. 2013 Apr 23;110(17):6985-90. doi: 10.1073/pnas.1215770110. Epub 2013 Apr 8. Proc Natl Acad Sci U S A. 2013. PMID: 23569230 Free PMC article.
-
Modulation of Toll-interleukin 1 receptor mediated signaling.J Mol Med (Berl). 2005 Apr;83(4):258-66. doi: 10.1007/s00109-004-0622-4. Epub 2005 Jan 21. J Mol Med (Berl). 2005. PMID: 15662540 Review.
-
[Progress in TcpC research].Zhejiang Da Xue Xue Bao Yi Xue Ban. 2013 Sep;42(5):481-5. Zhejiang Da Xue Xue Bao Yi Xue Ban. 2013. PMID: 24167126 Review. Chinese.
Cited by
-
Human Renal Fibroblasts, but Not Renal Epithelial Cells, Induce IL-1β Release during a Uropathogenic Escherichia coli Infection In Vitro.Cells. 2021 Dec 13;10(12):3522. doi: 10.3390/cells10123522. Cells. 2021. PMID: 34944029 Free PMC article.
-
Outer Membrane Vesicles and Soluble Factors Released by Probiotic Escherichia coli Nissle 1917 and Commensal ECOR63 Enhance Barrier Function by Regulating Expression of Tight Junction Proteins in Intestinal Epithelial Cells.Front Microbiol. 2016 Dec 15;7:1981. doi: 10.3389/fmicb.2016.01981. eCollection 2016. Front Microbiol. 2016. PMID: 28018313 Free PMC article.
-
Toll-like receptors, signaling adapters and regulation of the pro-inflammatory response by PI3K.Cell Cycle. 2012 Oct 1;11(19):3559-67. doi: 10.4161/cc.21572. Epub 2012 Aug 16. Cell Cycle. 2012. PMID: 22895011 Free PMC article. Review.
-
Involvement of NLRP3 and NLRC4 Inflammasome in Uropathogenic E. coli Mediated Urinary Tract Infections.Front Microbiol. 2019 Sep 3;10:2020. doi: 10.3389/fmicb.2019.02020. eCollection 2019. Front Microbiol. 2019. PMID: 31551961 Free PMC article.
-
Analysis of the Virulence of Uropathogenic Escherichia coli Strain CFT073 in the Murine Urinary Tract.Bio Protoc. 2017 Feb 5;7(3):e2129. doi: 10.21769/BioProtoc.2129. eCollection 2017 Feb 5. Bio Protoc. 2017. PMID: 34458450 Free PMC article.
References
-
- Poltorak A, He X, Smirnova I, Liu MY, Van Huffel C, et al. Defective LPS signaling in C3H/HeJ and C57BL/10ScCr mice: mutations in Tlr4 gene. Science. 1998;282:2085–2088. - PubMed
-
- Rodriguez N, Wantia N, Fend F, Durr S, Wagner H, et al. Differential involvement of TLR2 and TLR4 in host survival during pulmonary infection with Chlamydia pneumoniae. Eur J Immunol. 2006;36:1145–1155. - PubMed
-
- Kawai T, Akira S. TLR signaling. Cell Death Differ. 2006;13:816–825. - PubMed
-
- Kawai T, Sato S, Ishii KJ, Coban C, Hemmi H, et al. Interferon-alpha induction through Toll-like receptors involves a direct interaction of IRF7 with MyD88 and TRAF6. Nat Immunol. 2004;5:1061–1068. - PubMed
-
- Thomassen E, Renshaw BR, Sims JE. Identification and characterization of SIGIRR, a molecule representing a novel subtype of the IL-1R superfamily. Cytokine. 1999;11:389–399. - PubMed
Publication types
MeSH terms
Substances
LinkOut - more resources
Full Text Sources
Other Literature Sources
Medical
Molecular Biology Databases
