

doi: 10.1002/anie.201003142.
A nanoparticle size series for in vivo fluorescence imaging
Affiliations
- PMID: 20886481
- PMCID: PMC3035057
- DOI: 10.1002/anie.201003142
Item in Clipboard
A nanoparticle size series for in vivo fluorescence imaging
Angew Chem Int Ed Engl.
.
No abstract available
Figures
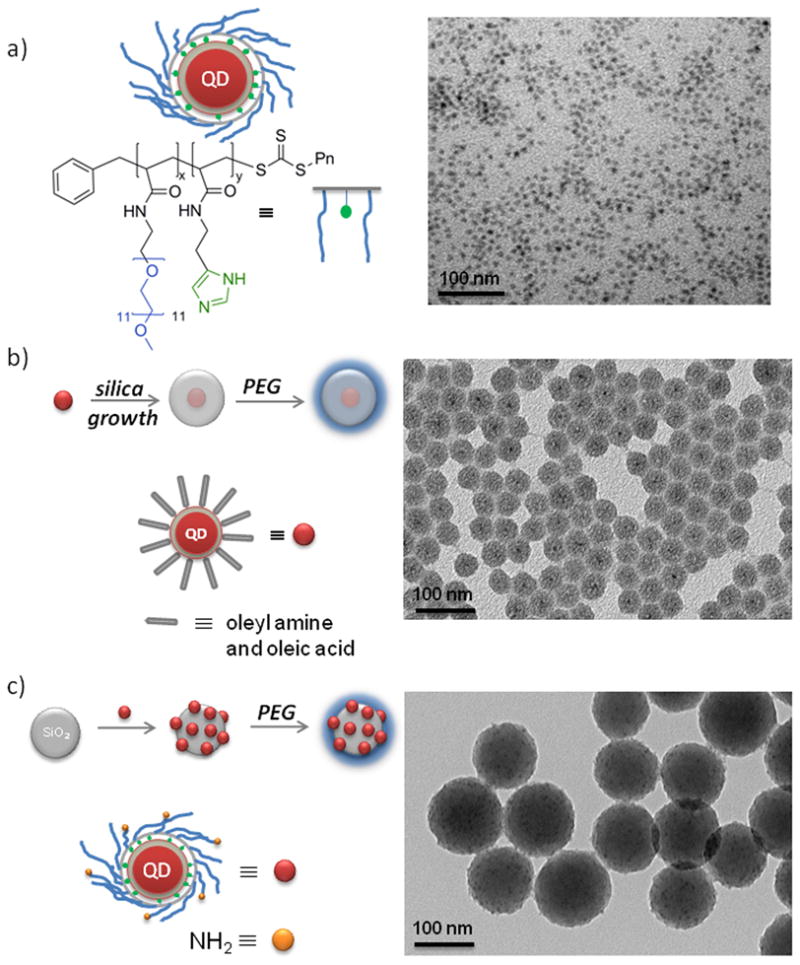
QD-based size series of particles and corresponding TEM images; a) water soluble PIL-coated QDs (10–20 nm), b) single QDs with PEGylated silica shell synthesized via reverse micelles (20–70 nm), and c) silica spheres with electrostatically assembled PIL-coated QDs followed by PEGylation for enhanced stability (100–150 nm). Scale bars are 20nm (a) and 100 nm (b, c) in length.
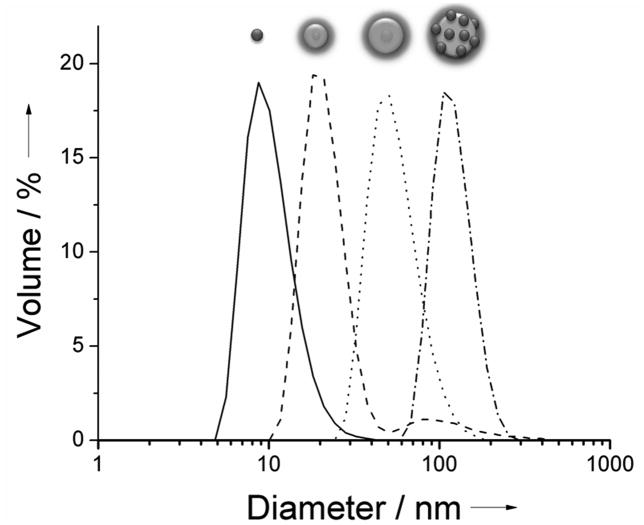
Dynamic light scattering (DLS) data for water solutions of PEGylated particles. Peak values from left to right: PIL-coated QDs (–, diameter 10.7 ± 2.4 nm), inverse-micelle QD-silica-PEG5000 (---, diameter 21.6 ± 3.1 nm 91.4% by volume), inverse-micelle QD-silica-PEG5000 (•••••, diameter 56.7 ± 10.1 nm), electrostatically assembled QD-silica-PEG5000 (–•–, diameter 122.4 ± 15.6 nm).
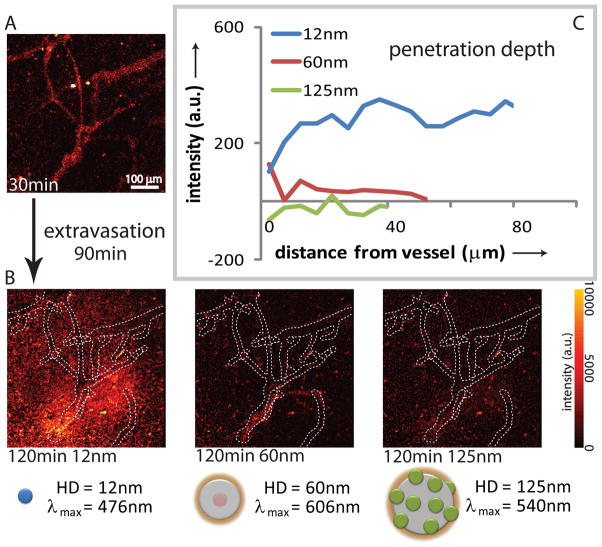
Intravital imaging of size-dependent nanoparticle distribution in real time. Intravenous injection into a SCID mouse bearing an Mu89 melanoma in a dorsal skinfold chamber with a mixture of nanoparticles with diameters of 12 nm (476 nm emission), 60 nm (606 nm emission), and 125 nm (540 nm emission). a) Representative multiphoton microscopy image demonstrates the distribution of nanoparticles at 30 min after the injection. b) Multiphoton microscopy images demonstrate distribution of the nanoparitcle in the same resion as (a) at 120 min post-injection (red-yellow hues). The distribution at ~30 min is shown as, dotted white overlay based on 3D vascular tracing. Images are mean intensity projections of 3D volumes; scale bar – 100 μm. c) Penetration depth analysis at 60 min post-injection, with intensity profiles averaged over all 3D vectors normal to the vessels based on 3D vascular tracing. The images and analysis indicate that the 12nm particles effectively extravasate and diffuse away ~100 μm in 60 min, while the 60 nm particles remain within 10 μm of the vessel walls and the 125 nm particles do not appreciably extravasate.
Similar articles
-
Mitigation of quantum dot cytotoxicity by microencapsulation.PLoS One. 2011;6(7):e22079. doi: 10.1371/journal.pone.0022079. Epub 2011 Jul 21. PLoS One. 2011. PMID: 21814567 Free PMC article.
-
Lighting-up the dynamics of telomerization and DNA replication by CdSe-ZnS quantum dots.J Am Chem Soc. 2003 Nov 19;125(46):13918-9. doi: 10.1021/ja035848c. J Am Chem Soc. 2003. PMID: 14611202
-
Photoactivation of CdSe/ZnS quantum dots embedded in silica colloids.Small. 2008 Sep;4(9):1516-26. doi: 10.1002/smll.200700997. Small. 2008. PMID: 18712754
-
Semiconductor quantum dots as biological imaging agents.Angew Chem Int Ed Engl. 2004 Aug 13;43(32):4129-31. doi: 10.1002/anie.200301758. Angew Chem Int Ed Engl. 2004. PMID: 15307073 Review. No abstract available.
-
Stability and fluorescence quantum yield of CdSe-ZnS quantum dots--influence of the thickness of the ZnS shell.Ann N Y Acad Sci. 2008;1130:235-41. doi: 10.1196/annals.1430.021. Ann N Y Acad Sci. 2008. PMID: 18596353 Review.
Cited by
-
Inorganic nanosystems for therapeutic delivery: status and prospects.Adv Drug Deliv Rev. 2013 Jan;65(1):93-9. doi: 10.1016/j.addr.2012.08.011. Epub 2012 Sep 4. Adv Drug Deliv Rev. 2013. PMID: 22981754 Free PMC article. Review.
-
Evaluating the pharmacokinetics and in vivo cancer targeting capability of Au nanocages by positron emission tomography imaging.ACS Nano. 2012 Jul 24;6(7):5880-8. doi: 10.1021/nn300464r. Epub 2012 Jun 19. ACS Nano. 2012. PMID: 22690722 Free PMC article.
-
Nanotechnology in cancer diagnosis: progress, challenges and opportunities.J Hematol Oncol. 2019 Dec 17;12(1):137. doi: 10.1186/s13045-019-0833-3. J Hematol Oncol. 2019. PMID: 31847897 Free PMC article. Review.
-
Targeted Cytokine Delivery for Cancer Treatment: Engineering and Biological Effects.Pharmaceutics. 2023 Jan 19;15(2):336. doi: 10.3390/pharmaceutics15020336. Pharmaceutics. 2023. PMID: 36839658 Free PMC article. Review.
-
Enhancing cancer immunotherapy with nanomedicine.Nat Rev Immunol. 2020 May;20(5):321-334. doi: 10.1038/s41577-019-0269-6. Epub 2020 Jan 31. Nat Rev Immunol. 2020. PMID: 32005979 Free PMC article. Review.
References
-
- Jain RK. Advanced Drug Delivery Reviews. 2001;46:149. - PubMed
-
- Nel AE, Madler L, Velegol D, Xia T, Hoek EM, Somasundaran P, Klaessig F, Castranova V, Thompson M. Nat Mater. 2009;8:543. - PubMed
-
- Perrault SD, Walkey C, Jennings T, Fischer HC, Chan WCW. Nano Letters. 2009;9:1909. - PubMed
-
- Yuan F, Dellian M, Fukumura D, Leunig M, Berk DA, Torchilin VP, Jain RK. Cancer Research. 1995;55:3752. - PubMed
Publication types
MeSH terms
Substances
Grants and funding
- T32 CA073479/CA/NCI NIH HHS/United States
- 1U54-CA119349/CA/NCI NIH HHS/United States
- R01 CA126642/CA/NCI NIH HHS/United States
- R01-CA085140/CA/NCI NIH HHS/United States
- R01 CA085140/CA/NCI NIH HHS/United States
- R01-CA115767/CA/NCI NIH HHS/United States
- P01-CA080124/CA/NCI NIH HHS/United States
- R01-CA096915/CA/NCI NIH HHS/United States
- U54 CA119349/CA/NCI NIH HHS/United States
- R01 CA115767/CA/NCI NIH HHS/United States
- R01 CA096915/CA/NCI NIH HHS/United States
- P01 CA080124/CA/NCI NIH HHS/United States
- R01-CA126642/CA/NCI NIH HHS/United States
LinkOut - more resources
Full Text Sources
Other Literature Sources
