Comparative Study
. 2010 Nov 15;518(22):4491-512.
doi: 10.1002/cne.22466.

Comparative studies of diurnal and nocturnal rodents: differences in lifestyle result in alterations in cortical field size and number

Affiliations
Comparative Study

Comparative studies of diurnal and nocturnal rodents: differences in lifestyle result in alterations in cortical field size and number

Katharine L Campi et al. J Comp Neurol. .

Abstract

In this study we examine and describe the neuroanatomical organization of sensory cortex in four rodents: laboratory Norway rats (Long Evans; Rattus norvegicus), wild-caught Norway rats (Rattus norvegicus), wild-caught California ground squirrels (Spermophilus beecheyi), and wild-caught Eastern gray squirrels (Sciurus carolinensis). Specifically, we examined the myeloarchitecture and cytochrome oxidase reactivity for several well-identified areas in visual cortex (areas 17, 18, and 19), somatosensory cortex (areas S1, S2 and PV), and auditory cortex [areas A1+AAF (R) and TA] and compared the percentage of dorsolateral cortex devoted to each of these areas. Our results demonstrate that squirrels have a larger mean percentage of dorsolateral cortex devoted to visual areas than rats. The difference is due to the greater percentage of cortex devoted to known areas such as area 17 and area 18 and not simply to a difference in the number of visual areas, which ultimately makes this distinction even more pronounced. Furthermore, both rat groups have a larger percentage of the dorsolateral cortex devoted to somatosensory and auditory cortical areas. Differences within groups were also observed. The arboreal squirrel had a larger mean percentage of dorsolateral cortex devoted to areas 17 and 18 compared with the terrestrial squirrel. The laboratory Norway rat had a larger percentage of dorsolateral cortex devoted to both somatosensory and auditory areas than the wild-caught Norway rat. Our results indicate that differences in sensory apparatus, use of sensory systems, and niche are reflected in the organization and size of cortical areas.


Figures

Figure 1
Figure 1
Representative photographs of an extracted brain from each rodent group studied. A: Laboratory Norway rat. B: Wild-caught Norway rat. C: California ground squirrel. D: Eastern gray squirrel. These give a dorsal view of the extracted brains showing olfactory bulbs to the left (anterior) and cerebellum to the right (posterior). Scale bar = 5 mm. [Color figure can be viewed in the online issue, which is available at wileyonlinelibrary.com.]
Figure 2
Figure 2
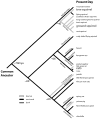
Phylogenetic tree of the order Rodentia with representative individuals of each family listed. The names of the rodent groups examined in this study are set off here by a larger font. Numbers reference time in millions of years ago (mya) to the present for the split of each group are listed. Taken from Huchon et al. (2002, 2007) and Steppan et al. (2004).
Figure 3
Figure 3
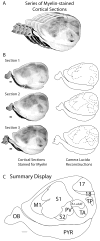
Methods of reconstruction from a series of flattened, myelin-stained sections. A: Myelin-stained section for successive cortical sections taken from the middle cortical layers. A camera lucida was used to trace the outline of the section, the rhinal sulcus, and the borders of the cortical areas. No single section accurately represents all of the cortical field boundaries, so the entire series of sections was reconstructed from each case, and the boundaries from those sections were compiled to make one comprehensive drawing to represent each hemisphere (middle right illustration). B: Photomicrographs of three sections are shown in the first column and camera lucida tracings are shown in the second column. The camera lucida tracings were aligned by using blood vessels. C: Summary display made by combining all of the individual drawings and using the largest outline from each tracing as the outer border. Rostral is to the left; medial is upward. See list for abbreviations. Scale bars = 1 mm.
Figure 4
Figure 4
Myeloarchitecture in flattened cortical sections from four species of rodent. Photomicrographs of one section from each species are shown here. The first section (A) is from the laboratory Norway rat. The second section (B) is from the wild-caught Norway rat. The third section (C) is from the California ground squirrel. The fourth section (D) is from the Eastern gray squirrel. Dashed lines denote primary areas. Not all boundaries of cortical fields can be observed in a single section. In all of these sections, S1 and area 17 can be readily identified. However, the auditory core is clearly observed only in rats in these sections. Conventions as in previous figures. See list for abbreviations. Scale bars = 1 mm.
Figure 5
Figure 5
Summary displays from representative cases from laboratory Norway rats (A), wild Norway rats (B), California ground squirrels (C), and Eastern gray squirrels (D). The key to areas is at right. Primary sensory areas are solid black. Second sensory areas are gray. Extrastriate cortical areas are spotted. Motor cortex is hatched. Area 3a is white bounded by a black line. Comprehensive reconstructions such as these were used to make cortical field measurements. Rostral is to the left; medial is upward. See list for abbreviations. Scale bars = 1 mm.
Figure 6
Figure 6
Histograms of mean percentage for brain-to-body ratios (A), hemispheres-to-whole brain percentages (B), and EQ (C). In all histograms, the x-axis is the rodent group. In A, the y-axis is percentage of brain weight to body weight; in B, the y-axis is percentage of hemisphere weight to whole-brain weight; and, in C, the y-axis is the quotient ratio. The key to bar colors is at right. Laboratory Norway rats are represented by solid black bars. Wild-caught Norway rats are represented by solid white bars. California ground squirrels are represented by black bars with white stripes. Eastern gray squirrels are represented by gray bars. Wild-caught rats have a significantly larger brain to body weight and percentage of cortical hemisphere compared with laboratory rats. Tree squirrels have a significantly larger brain to body weight and percentage of cortical hemisphere to whole brain compared with laboratory rats and wild rats, respectively. Tree squirrels have a significantly larger EQ compared with all of the rodents studied. Error bars represent SEM. Asterisk indicates a significant, P < 0.05, difference.
Figure 7
Figure 7
Histograms showing the percentage of dorsolateral cortex devoted to visual (A), somatosensory/motor (B), and auditory sensory (C) areas in each species. The x-axis for all histograms shows the specific area of cortex, and the y-axis shows the percentage of neocortex. The key to bar colors is at right. Laboratory Norway rats are represented by solid black bars. Wild-caught Norway rats are represented by solid white bars. California ground squirrels are represented by black bars with white stripes. Eastern gray squirrels are represented by gray bars. Significant differences are observed both between groups and between animals for visual, somatosensory, and auditory cortices. Error bars represent SEM. Significant differences between squirrel groups and rat groups are depicted with a thick line with an asterisk above, and significant differences between animals are indicated by a thin line with asterisk above. Asterisk indicates a significant, P < 0.05, difference. See list for abbreviations.
Figure 8
Figure 8
A: Diagram of the dorsolateral cortex in squirrel. The box shows area of magnification for B and C. Photomicrographs of myelin-stained cortical sections showing area 17 in the California ground squirrel (B) and Eastern gray squirrel (C). The monocular (mono) and binocular (bino) segments have been labeled. In both animals, the binocular segment is more darkly myelinated and located laterally. Caudal is to the right; medial is upward. Scale bars = 1 mm.
Figure 9
Figure 9
Photomicrographs of myelin-stained cortical sections highlighting area TP in each rodent group. A: Diagram of the dorsolateral cortex in Norway rat. The box shows area of magnification for the Laboratory Norway rat (B) and the wild-caught Norway rat (C). D: Diagram of the dorsolateral cortex in squirrels. The box shows area of magnification for the California ground squirrel (E) and the Eastern gray squirrel (F). In all animals examined, TP is a darkly myelinated, triangular wedge located caudally near the edge of the cortical section. Caudal is to the right; medial is upward. See list for abbreviations. Scale bars = 1 mm.
Figure 10
Figure 10
Photomicrographs of myelin-stained cortical sections highlighting area S1 in each rodent group. In all animals, S1 is narrow at its medial pole and widens through the middle and lateral edge with patches of dark and light myelin staining. These patches or isomorphs represent specific body parts. A: Diagram of the dorsolateral cortex in Norway rat. The box shows area of magnification for the Laboratory Norway rat (B) and the wild-caught Norway rat (C). D: Diagram of the dorsolateral cortex in squirrels. The box shows area of magnification for the California ground squirrel (E) and the Eastern gray squirrel (F). Caudal is to the right; medial is upward. See list for abbreviations. Scale bars = 1 mm.
Figure 11
Figure 11
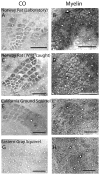
Photomicrographs of barrel cortex for each rodent group as seen in CO-stained (left column) and myelin-stained (right column) tissue. In laboratory Norway rats (A,B) and wild-caught Norway rats (C,D), barrel cortex is distinct in both CO and myelin stains. The myelin-stained barrels are hollow and appear to be a negative of the dense CO barrels. In California ground squirrels (E,F), the barrel cortex can be observed in CO stains (E) but is less distinct in myelin stains compared with CO stains and compared with rats. In the Eastern gray squirrel (G,H), barrel cortex is absent in CO-stained tissue (G) an indistinct in myelin-stained tissue (H). Caudal is to the right; medial is upward. See list for abbreviations. Scale bars = 1 mm.
Figure 12
Figure 12
Photomicrographs of myelin-stained cortical sections highlighting auditory cortex (AC) in each rodent group. Only a caudal portion of each section is shown to highlight AC for each rodent group. A1 + AAF (R) is a darkly myelinated, oval core auditory area (arrow) medial to the more lightly myelinated TA. A1 and AAF (R) are not distinguishable from each other based on myeloarchitecture. A: Diagram of the dorsolateral cortex in Norway rat. The box shows area of magnification for the laboratory Norway rat (B) and the wild-caught Norway rat (C). D: Diagram of the dorsolateral cortex in squirrels. The box shows area of magnification for the California ground squirrel (E) and the Eastern gray squirrel (F). Caudal is to the right; medial is upward. See list for abbreviations. Scale bars = 1 mm.

Similar articles

Cited by

References

    1. Adams AD, Forrester JM. The projection of the rat’s visual field on the cerebral cortex. Q J Exp Physiol Cogn Med Sci. 1968;53:327–336. - PubMed
    1. Allman JM, Kaas JH. Representation of the visual field in striate and adjoining cortex of the owl monkey (Aotus trivirgatus) Brain Res. 1971;35:89–106. - PubMed
    1. Allman JM, Kaas JH. The organization of the second visual area (V II) in the owl monkey: a second order transformation of the visual hemifield. Brain Res. 1974;76:247–265. - PubMed
    1. Amir S, Robinson B. Fos expression in rat visual cortex induced by ocular input of ultraviolet light. Brain Res. 1996;716:213–218. - PubMed
    1. Benison AM, Rector DM, Barth DS. Hemispheric mapping of secondary somatosensory cortex in the rat. J Neurophysiol. 2007;97:200–207. - PubMed

Publication types