. 2010 Nov 15;518(22):4546-66.
doi: 10.1002/cne.22477.

Quantitative analysis of the bilateral brainstem projections from the whisker and forepaw regions in rat primary motor cortex

Affiliations

Quantitative analysis of the bilateral brainstem projections from the whisker and forepaw regions in rat primary motor cortex

Kevin D Alloway et al. J Comp Neurol. .

Abstract

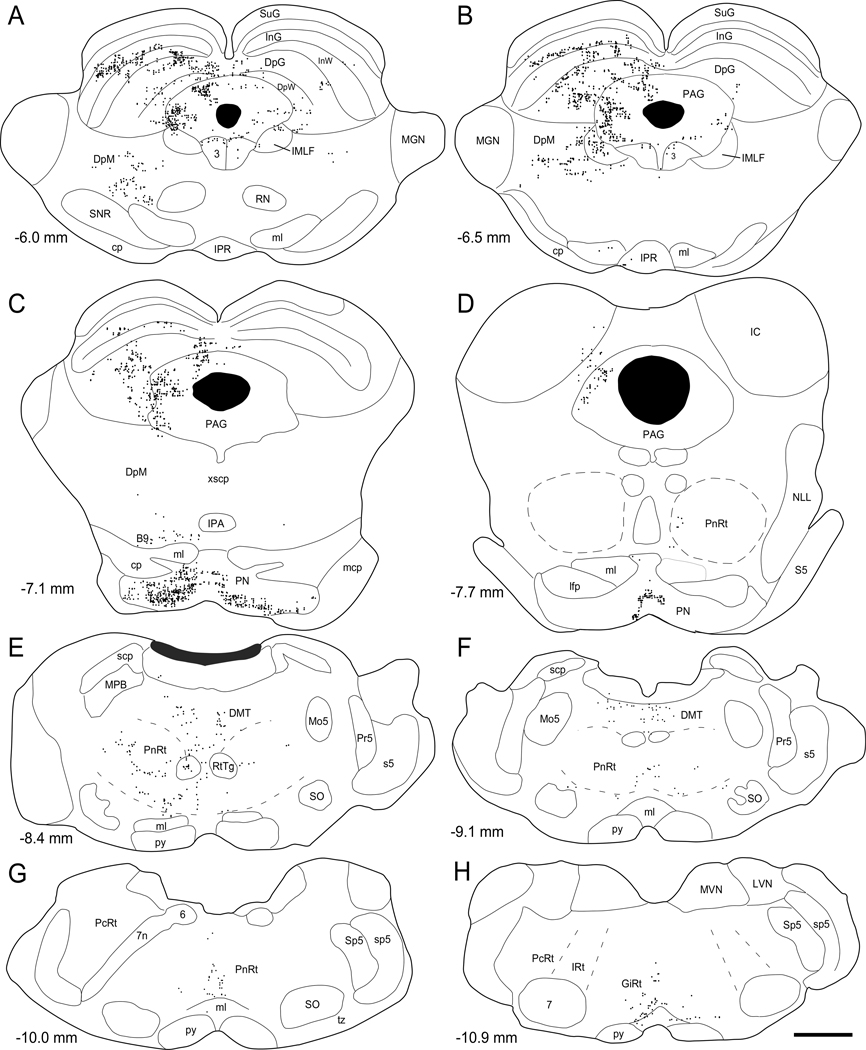
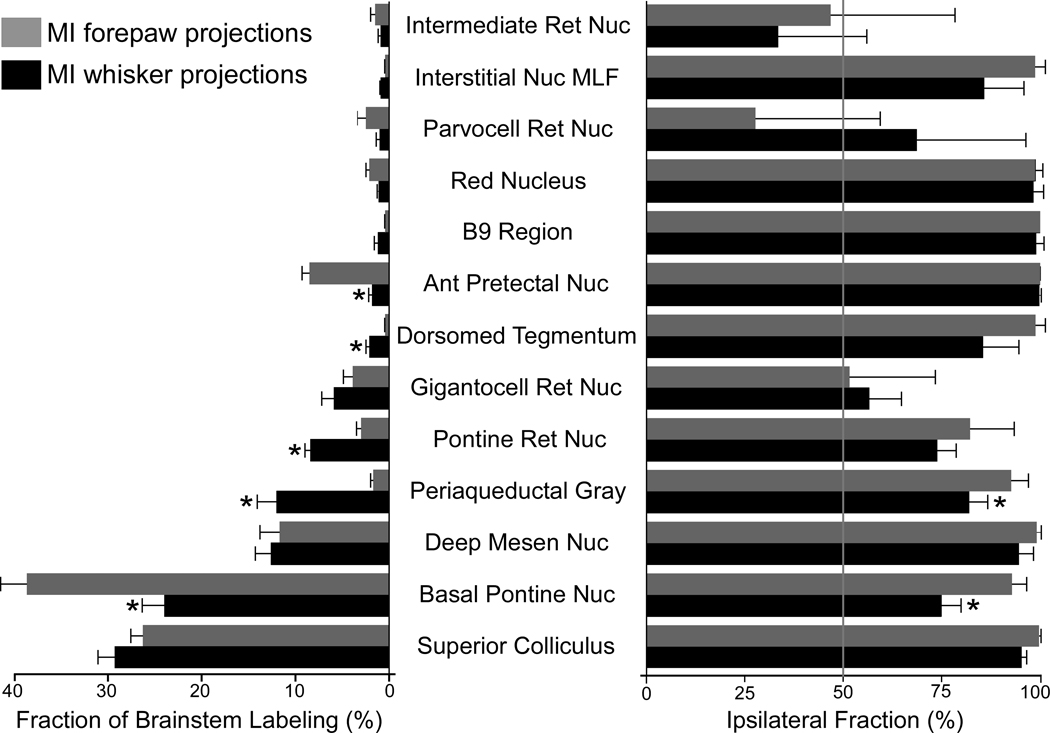
The whisker region in rat primary motor (MI) cortex projects to several brainstem regions, but the relative strength of these projections has not been characterized. We recently quantified the MI projections to bilateral targets in the forebrain (Alloway et al. [2009] J Comp Neurol 515:548-564), and the present study extends those findings by quantifying the MI projections to bilateral targets in the brainstem. We found that both the whisker and forepaw regions in MI project most strongly to the basal pons and superior colliculus. While the MI forepaw region projects mainly to the ipsilateral basilar pons, the MI whisker region has significantly more connections with the contralateral side. This bilateral difference suggests that corticopontine projections from the MI whisker region may have a role in coordinating bilateral whisker movements. Anterograde tracer injections in MI did not reveal any direct projections to the facial nucleus, but retrograde tracer injections in the facial nucleus revealed some labeled neurons in MI cortex. The number of retrogradely labeled neurons in MI, however, was dwarfed by a much larger number of labeled neurons in the superior colliculus and other brainstem regions. Together, our anterograde and retrograde tracing results indicate that the superior colliculus provides the most effective route for transmitting information from MI to the facial nucleus.


Figures

Fig. 1
Fig. 1
Distribution of Fluoro-ruby (FR) injection sites in primary motor (MI) cortex according to stereotaxic coordinates and the responses to intracranial microstimulation (ICMS). Sites where ICMS evoked movements of the contralateral forepaw are indicated by black circles. Sites that evoked whisker movements in a specific row are color-coded according to the legend; sites that evoked whisker movements in two rows are indicated by two colors. To compare the relative topography of injections across all 16 cases, FR injections in the left hemisphere (n = 2) are represented by mirror image coordinates for the right hemisphere. The two arrows indicate the FR injections for cases BN51 and BN53, results from which are illustrated in Figures 2 through 6. The gray region indicates the rhythmic whisking (RW) area identified by Haiss and Schwarz (2005).
Fig. 2
Fig. 2
Examples of FR injections into the MI whisker and MI forepaw regions. A: Section through the MI forepaw region of case BN51 processed for cytochrome oxidase (CO). B: Adjacent unstained section through the FR injection site of BN51. B`: Same section in panel B visualized with fluorescent microscopy. C: Section through the MI whisker region of case BN53 processed for CO. D: Adjacent unstained section through the FR injection site of BN53. D`: Same section in panel D visualized with fluorescent microscopy. Scale bars = 1.0 mm in A (applies to C), 500 µm in B (applies to B`, D, D`).
Fig. 3
Fig. 3
Bilateral distribution of FR-labeled varicosities in reconstructions of selected sections through the brainstem of MI whisker case BN53. Distance from bregma appears in the lower left of each plotted reconstruction. Scale, 1 mm.
Fig. 4
Fig. 4
MI whisker projections to the ipsilateral superior colliculus (SC) and periaqueductal gray (PAG) in case BN53. A: Section through SC and PAG processed for CO. A`: Adjacent section (6.72 mm caudal to bregma) used for plotting labeled varicosities in SC and PAG; boxes indicate the regions in panels B and D. A``: Plot of labeled varicosities superimposed on the section in panel A`. B,C: Photomicrographs of FR-labeled terminals in the deep gray layer of the SC; box in panel B indicates the region in panel C. D,E: Photomicrographs of FR-labeled terminals in the PAG; box in panel D indicates the region in panel E. Scale bars = 1.0 mm in A (applies to A`, A``); 100 µm in B (applies to D), 50 µm in C (applies to E).
Fig. 5
Fig. 5
Bilateral MI whisker projections to the basal pons in case BN53. A: Section through the pons processed for CO. A`: Adjacent section (7.1 mm caudal to bregma) used for plotting labeled varicosities; box indicates the region in panel B. A``: Plot of labeled varicosities superimposed on the section in panel A`. B,C: Microscopic views of FR-labeled terminals in the basal pons; box in panel B indicates the region in panel C. Scale bars = 1.0 mm in A (applies to A`, A``); 100 µm in B, 50 µm in C.
Fig. 6
Fig. 6
Bilateral distribution of FR-labeled varicosities in reconstructions of selected sections through the brainstem of MI forepaw case BN51. Distance from bregma appears in the lower left of each plotted reconstruction. Scale, 1 mm.
Fig. 7
Fig. 7
Regional distribution of MI projections to the brainstem. Left bargraph represents the normalized distribution of plotted varicosities in the brainstem structures listed in the center of the figure. Each bar represents the mean fraction of the sum of the plotted varicosities in the listed structures, based on FR injections in 8 rats for each group. Right bargraph indicates the mean proportion of plotted varicosities in each structure that appeared ipsilateral to the injection site. Bars lower than 50% indicate brain regions where the majority of varicosities were located contralateral to the FR injection. Brackets represent SEM; asterisks indicate significant differences between MI whisker and forepaw injections (p < 0.01; Student t-test).
Fig. 8
Fig. 8
Mean density of plotted varicosities in 13 brainstem regions. Each bar represents the mean density from 8 cases for the side of the brainstem (usually ipsilateral) that contained the majority of plotted varicosities. Brain regions are ordered according to the total number of plotted varicosities as shown in Figure 7. Horizontal line indicates median density; brackets indicate SEM.
Fig. 9
Fig. 9
Confocal images of the densest terminal labeling in the brainstem regions that contained the largest number of plotted varicosities. Images were obtained either from BN53 or BN45, both of which received FR injections in the MI whisker region. A: Basal pons. B: Superior colliculus. C: Periaqueductal gray region D: Deep mesencephalic nucleus. E: Pontine reticular nucleus. F: Gigantocellular reticular nucleus. Scale, 25 µm.
Fig 10
Fig 10
Peak density of labeled varicosities in the brainstem regions that received the most projections from the whisker and forepaw regions in MI. A: Absolute peak density. B: Normalized peak density. The region with the highest density is defined as 100% and the other 5 regions are represented proportionate to that amount. Each bar represents the mean of 3 cases; brackets represent SEM.
Fig. 11
Fig. 11
Retrograde tracer injection into the facial nucleus. A: Thionin-stained section through the facial nucleus. B: Magnified view of the facial nucleus illustrating the medial (M), intermediate (I), dorsal (D), and lateral (L) subnuclei. B`: Adjacent section using fluorescent microscopy to reveal the Fluoro-Gold (FG) injection into the lateral facial nucleus. Note that the FG also diffused into the intermediate subnucleus. Scale bars = 500 µm in A; 250 µm in B,B`.
Fig. 12
Fig. 12
Midbrain neuronal labeling produced by the tracer injection in Figure 11. A: Reconstructed sections showing the distribution of FG-labeled neurons in the SC, PAG, DpM, and RN. Distance from bregma appears in the lower left of each plotted reconstruction. B: Thionin-stained section through the midbrain. Rectangles indicate approximate regions shown in panels C and F. C: Low power fluorescent microscopy showing FG-labeled neurons in SC and DpM. Rectangles indicate panels D and E. D: Labeled neurons in the deep gray layer of SC. E: Labeled neurons in the DpM. F: Low power fluorescent microscopy showing FG-labeled neurons in the RN. Rectangle indicates panel G. G: Labeled neurons in the RN. Scale bars = 1 mm in A; 500 µm in B; 250 µm in C and F; 100 µm in D, E, and G.
Fig. 13
Fig. 13
Neuronal labeling in MI cortex produced by the tracer injection in Figure 11. A: Reconstructions of FG-labeled neurons in MI. Distance from bregma appears in the lower left of each plotted reconstruction;.arrows indicate lateral neurons likely to be in the jaw, lip, and tongue representations. Box represents region in panels B and B`. B, B`: Adjacent sections through MI used for conventional (B) and fluorescent (B`) microscopy. Rectangle in B` indicates the region in panel C. C: Pair of FG-labeled neurons near the border between Agl and Agm. Rectangle indicates the region in panel D. D: Magnified view of two FG-labeled neurons as indicated by arrowheads; one was brightly-lit while the other was only faintly-labeled. Scale bars = 1 mm in A; 500 µm in B,B`; 200 µm in C; 50 µm in D.

References

    1. Alloway KD, Olson ML, Smith JB. Contralateral corticothalamic projections from MI whisker cortex: Potential route for modulating hemispheric interactions. J Comp Neurol. 2008;510:100–116. - PMC - PubMed
    1. Alloway KD, Smith JB, Beauchemin KJ. Bilateral projections from rat MI whisker cortex to the neostriatum, thalamus, and claustrum: Forebrain circuits for modulating whisking behavior. J Comp Neurol. 2009;515:548–564. - PMC - PubMed
    1. Berg RW, Kleinfeld D. Vibrissa movement elicited by rhythmic electrical microstimulation to motor cortex in the aroused rat mimics exploratory whisking. J Neurophysiol. 2003;90:2950–2963. - PubMed
    1. Brecht M, Krauss A, Muhammad S, Sinai-Esfahani L, Bellanca S, Margie TW. Organization of rat vibrissa motor cortex and adjacent areas according to cytoarchitectonics, micro-stimulation, and intracellular stimulation of identified cells. J Comp Neurol. 2004a;479:360–373. - PubMed
    1. Colechio EM, Alloway KD. Differential topography of the bilateral cortical projections to the whisker and forepaw regions in rat motor cortex. Brain Struct Funct. 2009;213:423–439. - PubMed

Publication types