

Postnatal development of N-methyl-D-aspartate receptor subunits 2A, 2B, 2C, 2D, and 3B immunoreactivity in brain stem respiratory nuclei of the rat
- PMID: 20887777
- PMCID: PMC2987514
- DOI: 10.1016/j.neuroscience.2010.09.055
Postnatal development of N-methyl-D-aspartate receptor subunits 2A, 2B, 2C, 2D, and 3B immunoreactivity in brain stem respiratory nuclei of the rat
Abstract
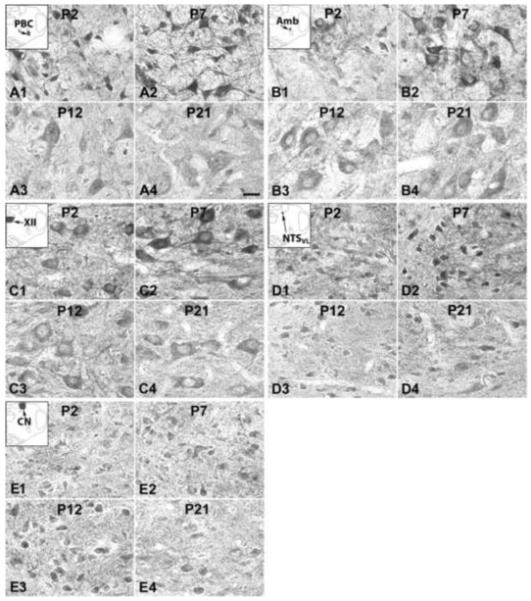
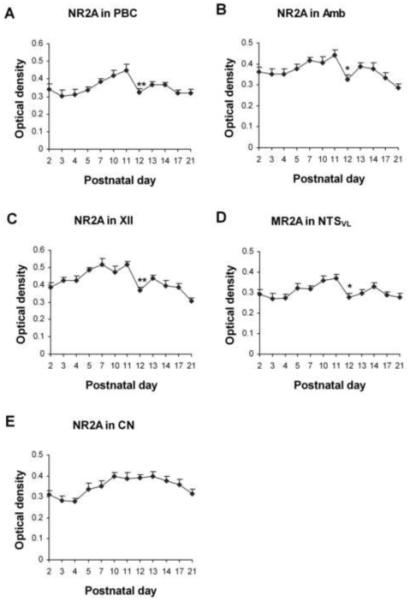
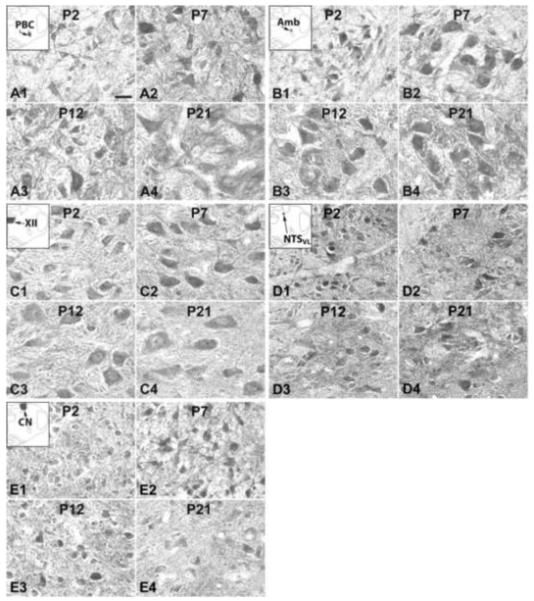
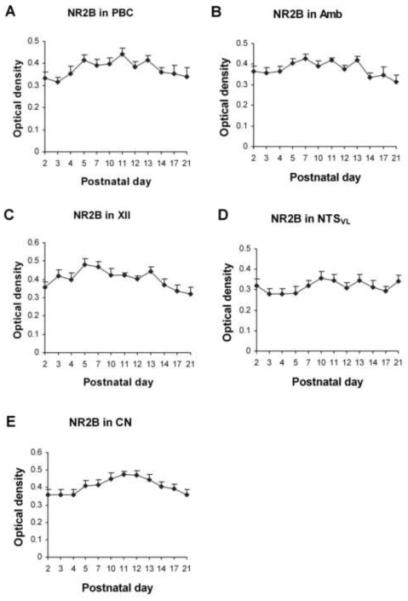
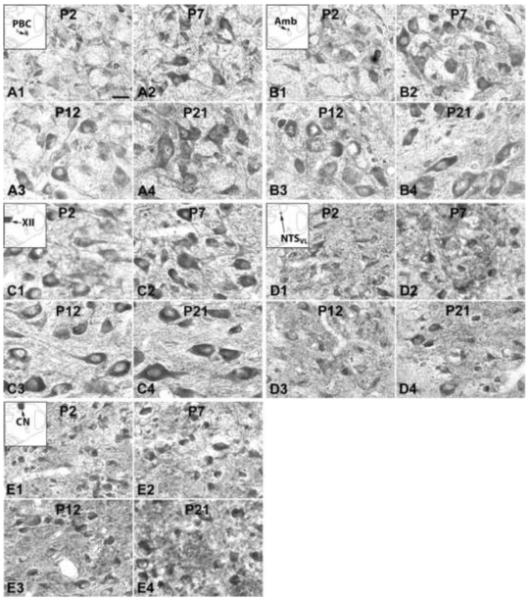
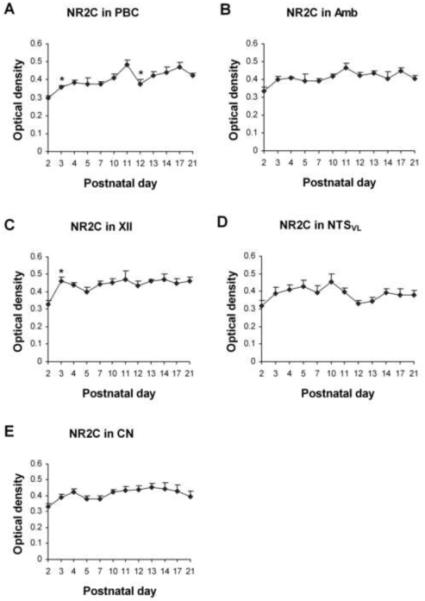
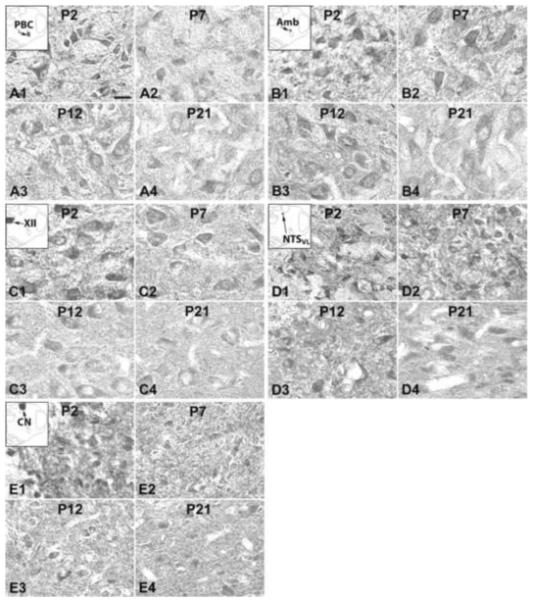
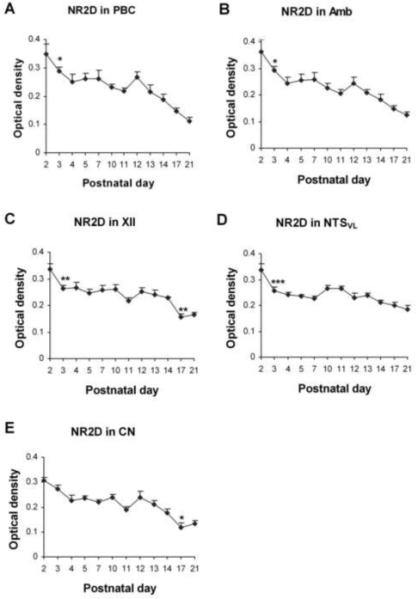
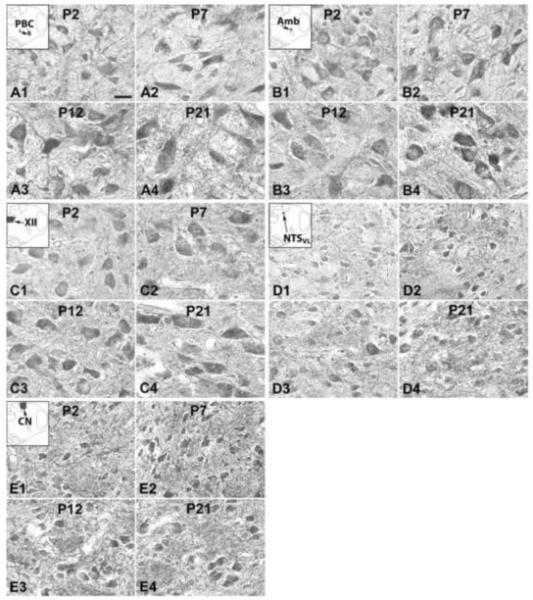
Previously, we reported that a critical period in respiratory network development exists in rats around postnatal days (P; P12-P13), when abrupt neurochemical, metabolic, and physiological changes occur. Specifically, the expressions of glutamate and N-methyl-d-aspartate (NMDA) receptor (NR) subunit 1 in the pre-Bötzinger complex (PBC), nucleus ambiguus (Amb), hypoglossal nucleus (XII), and ventrolateral subnucleus of solitary tract nucleus (NTS(VL)) were significantly reduced at P12. To test our hypothesis that other NR subunits also undergo postnatal changes, we undertook an in-depth immunohistochemical study of NR2A, 2B, 2C, 2D, and 3B in these four respiratory nuclei in P2-P21 rats, using the non-respiratory cuneate nucleus (CN) as a control. Our results revealed that: (1) NR2A expression increased gradually from P2 to P11, but fell significantly at P12 in all four respiratory nuclei (but not in the CN), followed by a quick rise and a relative plateau until P21; (2) NR2B expression remained relatively constant from P2 to P21 in all five nuclei examined; (3) NR2C expression had an initial rise from P2 to P3, but remained relatively constant thereafter until P21, except for a significant fall at P12 in the PBC; (4) NR2D expression fell significantly from P2 to P3, then plateaued until P12, and declined again until P21; and (5) in contrast to NR2D, NR3B expression rose gradually from P2 to P21. These patterns reflect a dynamic remodeling of NMDA receptor subunit composition during postnatal development, with a distinct reduction of NR2A expression during the critical period (P12), just as NR1 did in various respiratory nuclei. There was also a potential switch between the neonatal NR2D and the more mature NR3B subunit, possibly around the critical period. Thus, during the critical period, NMDA receptors are undergoing greater adjustments that may contribute to attenuated excitatory synaptic transmission in the respiratory network.
Copyright © 2010 IBRO. Published by Elsevier Ltd. All rights reserved.
Figures

Similar articles
-
Postnatal changes in the expressions of serotonin 1A, 1B, and 2A receptors in ten brain stem nuclei of the rat: implication for a sensitive period.Neuroscience. 2010 Jan 13;165(1):61-78. doi: 10.1016/j.neuroscience.2009.09.078. Epub 2009 Oct 2. Neuroscience. 2010. PMID: 19800944 Free PMC article.
-
Postnatal development of glycine receptor subunits α1, α2, α3, and β immunoreactivity in multiple brain stem respiratory-related nuclear groups of the rat.Brain Res. 2013 Nov 13;1538:1-16. doi: 10.1016/j.brainres.2013.09.028. Epub 2013 Sep 27. Brain Res. 2013. PMID: 24080401 Free PMC article.
-
Postnatal development of Na(+)-K(+)-2Cl(-) co-transporter 1 and K(+)-Cl(-) co-transporter 2 immunoreactivity in multiple brain stem respiratory nuclei of the rat.Neuroscience. 2012 May 17;210:1-20. doi: 10.1016/j.neuroscience.2012.03.018. Epub 2012 Mar 14. Neuroscience. 2012. PMID: 22441038 Free PMC article.
-
Neurochemical and physiological correlates of a critical period of respiratory development in the rat.Respir Physiol Neurobiol. 2008 Dec 10;164(1-2):28-37. doi: 10.1016/j.resp.2008.04.014. Respir Physiol Neurobiol. 2008. PMID: 18524695 Free PMC article. Review.
-
Developmental profiles of neurotransmitter receptors in respiratory motor nuclei.Respir Physiol Neurobiol. 2008 Dec 10;164(1-2):64-71. doi: 10.1016/j.resp.2008.04.012. Respir Physiol Neurobiol. 2008. PMID: 18514591 Free PMC article. Review.
Cited by
-
Effects of neonatal hyperoxia on the critical period of postnatal development of neurochemical expressions in brain stem respiratory-related nuclei in the rat.Physiol Rep. 2018 Mar;6(5):e13627. doi: 10.14814/phy2.13627. Physiol Rep. 2018. PMID: 29516654 Free PMC article.
-
Developmental changes in the morphology of mouse hypoglossal motor neurons.Brain Struct Funct. 2016 Sep;221(7):3755-86. doi: 10.1007/s00429-015-1130-8. Epub 2015 Oct 17. Brain Struct Funct. 2016. PMID: 26476929 Free PMC article.
-
Structure, Function, and Pharmacology of Glutamate Receptor Ion Channels.Pharmacol Rev. 2021 Oct;73(4):298-487. doi: 10.1124/pharmrev.120.000131. Pharmacol Rev. 2021. PMID: 34753794 Free PMC article. Review.
-
From Cannabinoids and Neurosteroids to Statins and the Ketogenic Diet: New Therapeutic Avenues in Rett Syndrome?Front Neurosci. 2019 Jul 2;13:680. doi: 10.3389/fnins.2019.00680. eCollection 2019. Front Neurosci. 2019. PMID: 31333401 Free PMC article. Review.
-
Learning to breathe: habituation of Hering-Breuer inflation reflex emerges with postnatal brainstem maturation.Respir Physiol Neurobiol. 2014 May 1;195:44-9. doi: 10.1016/j.resp.2014.02.009. Epub 2014 Feb 22. Respir Physiol Neurobiol. 2014. PMID: 24566392 Free PMC article.
References
-
- Barria A, Malinow R. NMDA receptor subunit composition controls synaptic plasticity by regulating binding to CaMKII. Neuron. 2005;48:289–301. - PubMed
-
- Bieger D, Hopkins DA. Viscerotopic representation of the upper alimentary tract in the medulla oblongata in the rat: the nucleus ambiguus. J Comp Neurol. 1987;262:546. - PubMed
-
- Bonham AC. Neurotransmitters in the CNS control of breathing. Respir Physiol. 1995;101:219–230. - PubMed
Publication types
MeSH terms
Substances
Grants and funding
LinkOut - more resources
Full Text Sources
Molecular Biology Databases
