. 2010 Oct 1;143(1):99-110.
doi: 10.1016/j.cell.2010.09.003.

Cell surface- and rho GTPase-based auxin signaling controls cellular interdigitation in Arabidopsis

Affiliations

Cell surface- and rho GTPase-based auxin signaling controls cellular interdigitation in Arabidopsis

Tongda Xu et al. Cell. .

Abstract

Auxin is a multifunctional hormone essential for plant development and pattern formation. A nuclear auxin-signaling system controlling auxin-induced gene expression is well established, but cytoplasmic auxin signaling, as in its coordination of cell polarization, is unexplored. We found a cytoplasmic auxin-signaling mechanism that modulates the interdigitated growth of Arabidopsis leaf epidermal pavement cells (PCs), which develop interdigitated lobes and indentations to form a puzzle-piece shape in a two-dimensional plane. PC interdigitation is compromised in leaves deficient in either auxin biosynthesis or its export mediated by PINFORMED 1 localized at the lobe tip. Auxin coordinately activates two Rho GTPases, ROP2 and ROP6, which promote the formation of complementary lobes and indentations, respectively. Activation of these ROPs by auxin occurs within 30 s and depends on AUXIN-BINDING PROTEIN 1. These findings reveal Rho GTPase-based auxin-signaling mechanisms, which modulate the spatial coordination of cell expansion across a field of cells.


Figures

Figure 1
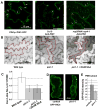
Figure 1. Auxin activation of PC interdigitation requires ROP2/4 (also see Figure S1)
(A): A schematic showing three stages of PC morphogenesis as described (Fu et al., 2005). (B): Auxin increased interdigitation of WT PCs and suppresses the PC interdigitation defect in the yuc1 yuc2 yuc4 yuc6 (yuc 1/2/4/6) quadruple mutant but not in the ROP2RNAi rop4-1. Seedlings were cultured in liquid MS with or without 20 nM NAA, and cotyledon PCs were imaged 4 days after stratification. (C): Quantitative analysis of PC interdigitation. The degree of interdigitation in PCs shown in (B) was quantified by determining the density of lobes for each PC (Figure S1A). Data are mean lobe number per μm2 ± SD (n>400 cells from three individual plants). The yuc mutant had a significantly lower density of lobes than Col-0 wild type, and NAA significantly increased the mean density of lobes in Col-0 WT and the yuc mutant (t-test, p<0.001) but not in the ROP2RNAi rop4-1 line (t-test, p>0.1). Non-biased double blind analysis confirms all of the phenotypic differences between mutants and treatments (Figure S1B).
Figure 2
Figure 2. Auxin rapidly activates ROP2 and ROP6 in a dosage dependent manner (also see Figure S2)
(A–B): Auxin dosage responses of ROP2 and ROP6 activation. Protoplasts from leaves of transgenic GFP-ROP2 or -ROP6 seedlings were treated with the indicated concentrations of NAA for 2 min (A), or treated with 100 nM NAA for the indicated times (B). GTP-bound active GFP-ROP2 or -ROP6 and total GFP-ROP2 or -ROP6 (GDP and GTP forms) were analyzed as described in text. Results from one out of five independent experiments with similar results are shown. ROP2 and ROP6 experiments were conducted in parallel under identical conditions. (C–D): Quantitative analysis of data from A and B. The relative ROP2 or ROP6 activity level was determined as the amount of GTP-bound ROP2 or ROP6 divided by the amount of total GFP-ROP2 or ROP6. The relative ROP activity in different treatments was standardized to that from mock-treated control, which was arbitrarily defined as “1”. Data are mean activity levels from five independent experiments ± SD. We tested the significance of difference in ROP activity level between ROP2 and ROP6 at various auxin levels using F-test. All the p-values are less than 0.001 except at 0 and 1 nM of auxin. We also compared mean values of ROP activity level using Tukey pairwise mean comparisons and found that ROP2 activity significantly increased at lower auxin levels, stabilized at median auxin levels, and significantly decreased at high auxin levels. In contrast, ROP6 activity significantly increased at low and median levels and stabilized at high auxin levels. Further details of the statistical analysis methods can be found in Figure S2
Figure 3
Figure 3. ABP1 is required for auxin perception that promotes PC interdigitation (also see Figure S3)
(A): The abp1-5 mutation (His59->Tyr) occurs within the auxin binding pocket (Woo et al., 2002). (Left) The crystal structure of maize ABP1 with bound NAA (PDB 1lrh). Maize ABP1 is a glycosylated homodimer that binds two NAA molecules (shown in red). Maize and Arabidopsis share 68% identity overall and 100% conservation in the binding pocket. (Right) The auxin-binding pocket is highlighted to show how H59 (sphere format) interacts with the carboxic acid group of NAA shown in red and with a zinc ion not shown (for clarity). (B): Defect in PC interdigitation in the abp1-5 mutant was not rescued by auxin. Seedlings were cultured in liquid MS with or without 20 nM NAA, and cotyledon PCs were imaged 4 days after stratification. (C): PC interdigitation shown in (B) was quantitated as in Figure 1C (n>400 cells from three individual plants). WT had significantly higher lobe intensity than abp1-5 (t-test, p<0.001). No significant difference was found between treatment with or without NAA (t-test, p>0.1). (D): The defect in PC interdigitation in an inducible ABP1 antisense line was not rescued by auxin. An ABP1 antisense construct was expressed upon ethanol treatment (Braun et al., 2008). Seedlings were cultured in liquid MS containing 0.5% ethanol with or without NAA, and cotyledon PCs were imaged 4 days after stratification. Without ethanol treatment, the PCs in this line were similar to WT PCs (Figure S3C). Upon ethanol induction, ABP1 antisense PCs were similar to the abp1-5 cells and were not altered by NAA. (E): PC interdigitation in the antisense line shown in (C) was quantitated as in Figure 1C (n>400 cells from three individual plants). WT had a significantly higher lobe density than the ABP1 antisense line in the absence of NAA (t-test, p<0.001), which did not show significant difference with NAA treatment (t-test, p>0.1). A double-blind analysis was performed and the results confirmed all of the phenotypic differences between mutants and treatments described in this figure (see Figure S3E).
Figure 4
Figure 4. Auxin can activate ROP2-RIC4 pathway through ABP1 (also see Figure S4)
(A) Measurement of GTP-bound GFP-ROP2 in protoplasts isolated from a abp1-5 line stably expressing 35S::GFP-ROP2 by co-immunoprecipitation assay described in Figure 2. The seedlings expressing GFP and homozygous for abp1-5 were pooled and used for protoplast isolation. Auxin did not activate ROP2 in abp1-5 mutants compared to in wild type where auxin activates ROP2 within 30secs (Figure. 2C). (B–C): Loss of auxin activation of ROP2 in the abp1-5 mutant and the induced ABP1 antisense line. GFP-RIC4 distribution to the PM in isolated protoplasts was used to report ROP2 activation by auxin. (B) Representative images of GFP-RIC4 distribution in protoplasts isolated from different lines before and 5 min after auxin application. The bright field images (left) show intact protoplasts corresponding to the GFP-RIC4 fluorescent images at time 0. See Figure. S4D-S4F for representative images from the complete time course analysis. (C) Quantitative analysis of GFP-RIC4 distribution to the PM (as indicated by relative GFP intensity in the PM standardized with the cytosolic GFP intensity). Data are mean values from 10 protoplasts analyzed ± SD.
Figure 5
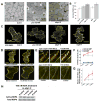
Figure 5. PIN1 is localized to the lobe tip and is essential for auxin promotion of PC interdigitation (also see Figure S5)
(A): Left: PIN1-GFP was preferentially localized to the tip of lobes in PC. Middle: Inmmuno-staining of PIN1 in PCs. Arrows indicates the accumulation of PIN1 at the lobe region. Right: Immuno-staining of PIN1 in ROP2RNAi rop4-1 mutant. Arrows (yellow) indicates the accumulation of PIN1 at the lobe region was lost in ROP2RNAi rop4-1. Arrowheads indicate internalized PIN1, which was greatly increased in the cytoplasm of ROP2RNAi rop4-1 cells. 75 cells from 3 repeats are used for quantification (Figure S5H). (B): PC shapes in wild type (left) and pin1-1 mutant (middle). pin1-1 PCs were slender with few lobes, a phenotype similar to a rop2-1rop4-1 double knockout mutant (data not shown). 20 nM NAA was unable to rescue pin1-1 phenotype in PCs (right). (C): Quantitative data for (B). Lobe numbers per cell area in pin1-1 mutant and pin1-1 mutant treated with 20 nM NAA were quantified using double blind analysis as described in Figure. S3. pin1-1 cells showed significantly reduced lobe formation compared to wide type (n=400, T-test p<0.001), and 20 nM NAA did not rescue this phenotype (n=400, T-test p>0.1). Higher NAA concentrations had no effect on the pin1-1 phenotype either (Figure. S5A and S5B). (D): GFP-RIC4 distribution pattern in PCs of wild type and pin1-1 mutant. GFP-RIC4 was localized to the cell cortex preferentially in lobe tips or lobe emergent sites of wild type PCs but was mostly diffuse in the cytosol in pin1-1 PCs. (E): Quantitative analysis of the cortical GFP-RIC4 signal was performed as described in Figure. S2. Cortical signal of GFP-RIC4 dramatically decreased in pin1-1 mutant (n>25, t-test p<0.001),
Figure 6
Figure 6. Auxin activates the ROP6-RIC1 pathway through ABP1 (also see Figure S6)
(A): PCs in both yuc1/2/4/6 and abp1-5 have wider neck regions than WT, similar to both rop6-1 and ric1-1 mutants (Fu et al., 2009; Fu et al., 2005), but different from ROP2RNAi rop4-1, which had narrower neck (Fu et al., 2005). (B): Quantitative analysis of PCs phenotype showed that both yuc1/2/4/6 (t-test, p<0.01) and abp1-5 (t-test, p<0.001) had significantly wider neck regions than WT. Data are mean neck width ± SD (n>400 cells). (C): YFP-RIC1 formed dot-like structures along cortical MTs in WT cells (left) (Fu et al., 2005; Fu et al., 2009). In yuc1/2/4/6 and abp1-5 cells, YFP-RIC1 lost its association with MTs as in rop6-1 (n>25). In rop6-1 mutants, YFP-RIC1 was mostly shifted to lobe regions (indicated by arrowheads) where ROP2 was presumably activated. This YFP-RIC1 localization pattern is different from that in the yuc1/2/4/6 and abp1-5 mutants, where YFP-RIC1 became diffusely localized to the cytosol because ROP2 is inactivated in these mutants. (D): Auxin enhanced YFP-RIC1 association with cortical MTs in a rop2-1 rop4-1 mutant, but not in the abp1-5 mutant. PCs transiently YFP-RIC1 were treated with NAA (10 nM) and imaged by confocal microscopy before and 10 min after treatment. In rop2-1 rop4-1 PCs, YFP-RIC1 was associated with MTs in a beads-on-a-string pattern. NAA enhanced this localization pattern as indicated by arrowheads. In abp1-5 cells, the weak YFP-RIC1 association with MTs did not show the dotted pattern and was not altered by NAA treatment. At least 15 cells were tracked for each mutant and showed similar response to NAA. Scale bar =10 μm. (E): A time-course analysis of YFP-RIC1 association with MTs. At 4 and 8 min after NAA treatment, YFP-RIC1 dots gradually increased in both intensity and number by auxin treatment in rop2-1 rop4-1 but not abp1-5 cells. (F–G). Quantitative analysis of YFP-RIC1 dot number and intensity shown in (D and E). (F) YFP-RIC1 association with MTs was measured by the number of YFP-RIC1 dots unit length of MTs. Data are mean dot number per μm ± SD (n=50). (G) Average intensity of YFP-RIC1 dots was measured from 0 mins to 8 mins. The intensity at time 0 was standardized as 1. Data are relative mean intensity compared to time 0 ± SD (n=100). (H). Auxin failed to increase ROP6 activity in abp1-5 muants. GTP-bound GFP-ROP6 in protoplasts isolated from a abp1-5 line stably expressing 35S::GFP-ROP6 was analyzed as described in Figure 2.
Figure 7
Figure 7. A working model for auxin control of interdigitated cell growth
(A): A model for coordination of two ROP signaling pathways by localized extracellular auxin, which results from a PIN1-mediated positive feedback loop. (B): A model for auxin control of interdigitated growth through inter- and intra-cellular coordination of the ROP2 and ROP6 pathways. We surmise that the PC intergditated growth is controlled by an auxin-dependent self-organizing mechanism. In this mechanism, localized extracellular auxin, which is generated by self-activation via the auxin→ROP2→PIN1→auxin feedback loop and self-maintenance via the antagonizing ROP6 pathway, controls cell-cell coordination of lobing and indentating by activating the complementary ROP2 and ROP6 pathways in two adjacent cells, which are mutually exclusive within each cell to allow for the formation of alternating lobes and indentations (Fu et al., 2005; Fu et al., 2009).

Comment in

References

    1. Abel S, Theologis A. Early genes and auxin action. Plant Physiol. 1996;111:9–17. - PMC - PubMed
    1. Altschuler SJ, Angenent SB, Wang Y, Wu LF. On the spontaneous emergence of cell polarity. Nature. 2008;454:886–889. - PMC - PubMed
    1. Badescu GO, Napier RM. Receptors for auxin: will it all end in TIRs? Trends Plant Sci. 2006;11:217–223. - PubMed
    1. Baxter-Burrell A, Yang Z, Springer PS, Bailey-Serres J. RopGAP4-dependent Rop GTPase rheostat control of Arabidopsis oxygen deprivation tolerance. Science. 2002;296:2026–2028. - PubMed
    1. Braun N, Wyzykowaska J, Couch D, David K, Muller P, Perrot-Rechenmann C, Fleming AJ. Conditional Repression of AUXIN BINDING PROTEIN 1 Shows That It Is Required During Post-Embryonic Shoot Development and Implicates ABP1 as a Co-ordinator of Cell Division and Cell Expansion. The Plant Cell. 2008;20:2746–2762. - PMC - PubMed

Publication types

MeSH terms