. 2010 Oct 15;143(2):212-24.
doi: 10.1016/j.cell.2010.09.009. Epub 2010 Sep 30.

Systematic protein location mapping reveals five principal chromatin types in Drosophila cells

Affiliations

Systematic protein location mapping reveals five principal chromatin types in Drosophila cells

Guillaume J Filion et al. Cell. .

Erratum in

  • Cell. 2011 Apr 1;145(1):160

Abstract

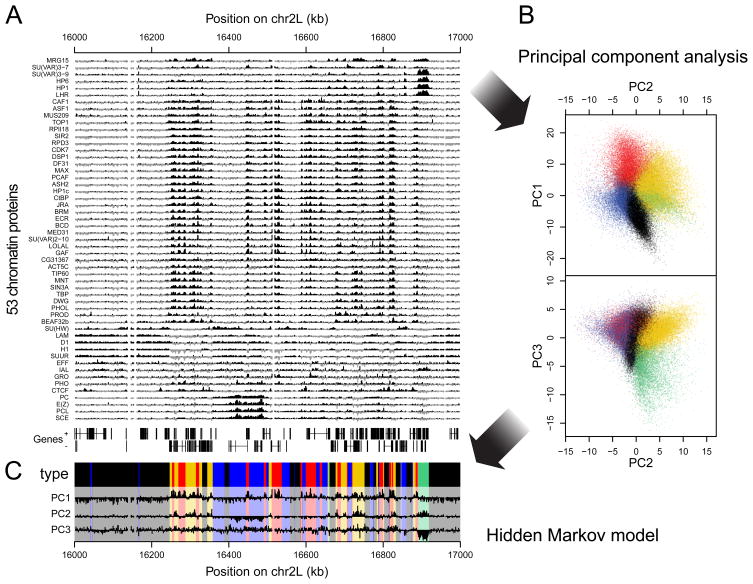
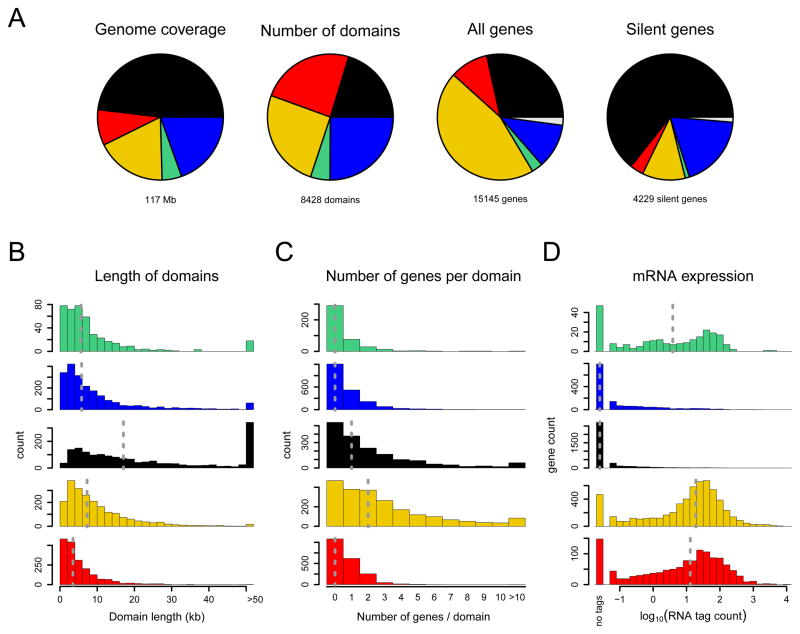
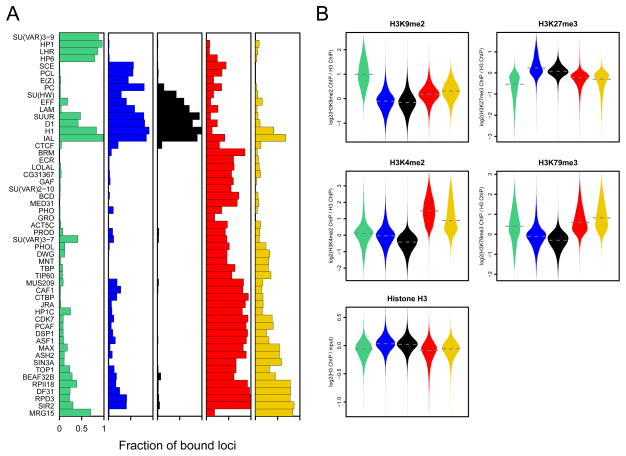
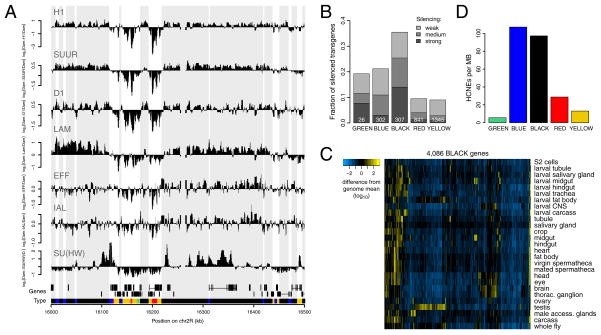
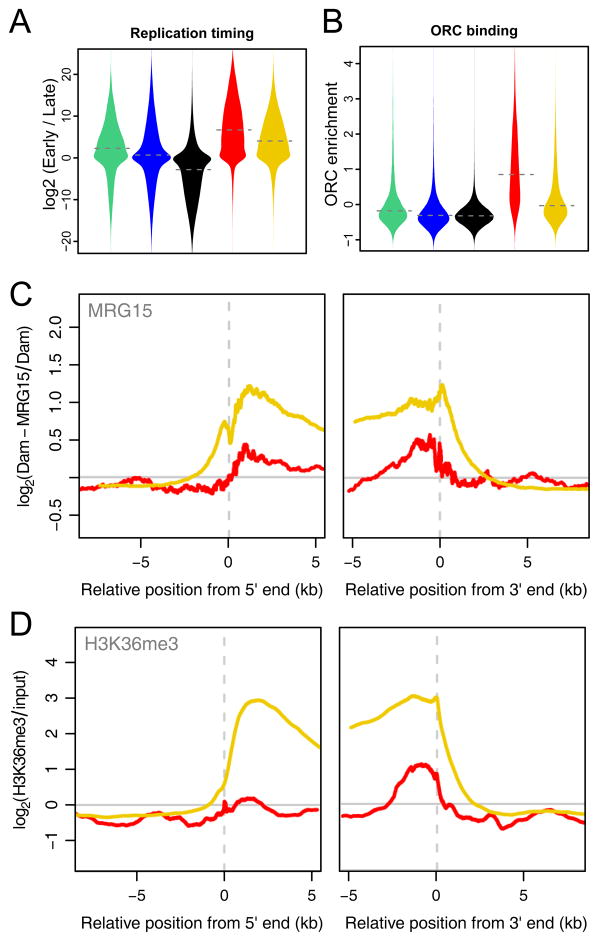
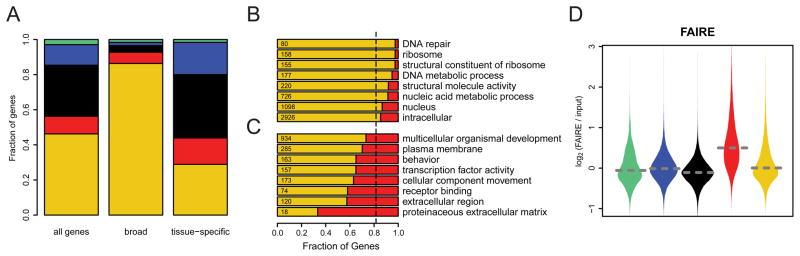
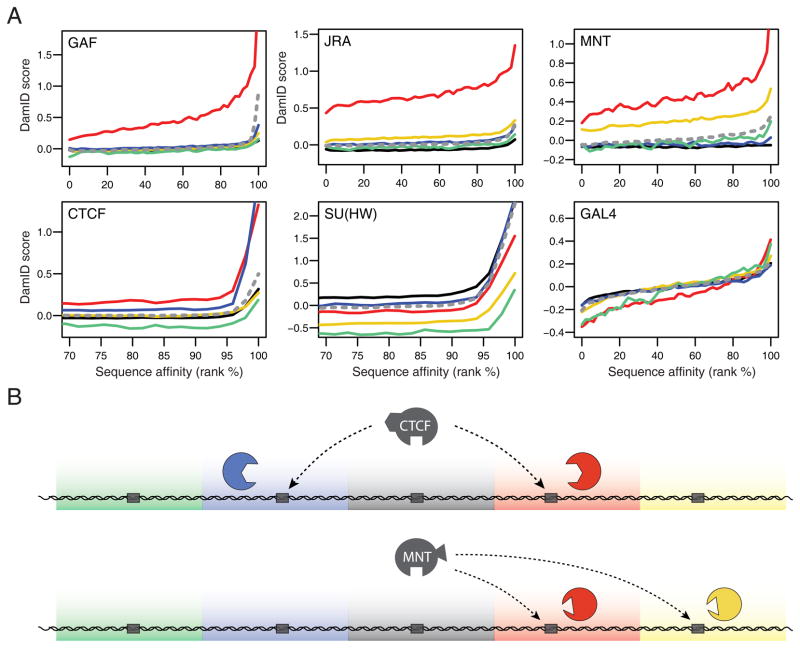
Chromatin is important for the regulation of transcription and other functions, yet the diversity of chromatin composition and the distribution along chromosomes are still poorly characterized. By integrative analysis of genome-wide binding maps of 53 broadly selected chromatin components in Drosophila cells, we show that the genome is segmented into five principal chromatin types that are defined by unique yet overlapping combinations of proteins and form domains that can extend over > 100 kb. We identify a repressive chromatin type that covers about half of the genome and lacks classic heterochromatin markers. Furthermore, transcriptionally active euchromatin consists of two types that differ in molecular organization and H3K36 methylation and regulate distinct classes of genes. Finally, we provide evidence that the different chromatin types help to target DNA-binding factors to specific genomic regions. These results provide a global view of chromatin diversity and domain organization in a metazoan cell.


Figures

Figure 1
Figure 1
Overview of protein binding profiles and derivation of the 5-type chromatin segmentation. (A) Sample plot of all 53 DamID profiles (log2 enrichment over Dam-only control). Positive values are plotted in black, negative values in grey for contrast. Below the profiles, genes on both strands are depicted as lines with blocks indicating exons. (B) Two-dimensional projections of the data onto the first three principal components. Colored dots indicate the chromatin type of probed loci as inferred by a 5-state HMM. (C) Values of the first three principal components along the region shown in (A), with domains of the different chromatin types after segmentation by the 5-state HMM highlighted by the same colors as in (B). See also Supplementary Figure S1 and Table S1.
Figure 2
Figure 2
Characteristics of the five chromatin types. (A) Coverage and gene content of chromatin domains of each type. The chromatin type of a gene is defined as the chromatin type at its transcription start site (TSS). Grey sectors correspond to genes whose TSS maps at the transition between two chromatin types. Silent genes have an average RNA tag count below 1 per million total tags (see (D)). (B) Length distribution of chromatin domains, i.e. genomic segments covered contiguously by one chromatin type. (C) Distribution of the number of genes per chromatin domain. Because some genes overlap with more than one domain, genes are assigned to a chromatin type based on the type at the transcription start site. (D) Histogram of mRNA expression determined by RNA tag profiling. Data are represented as log10 (tags per million total tags). Dashed vertical lines in (B)-(D) indicate medians.
Figure 3
Figure 3
Chromatin types are characterized by distinctive protein combinations and histone modifications. (A) Fraction of all probed genomic loci within each chromatin type that is bound by each protein. Bound loci were determined separately for each protein as described in the text. (B) Levels of histone H3 and four histone modifications as determined by genome-wide ChIP. The distribution of values is shown as “violin plots”, which are symmetrized density plots of binding values per chromatin type: the wider the violin, the more data points are associated to that value. Dashed horizontal lines indicate the median binding value for each chromatin type. Histone modification ChIP data were normalized to H3 occupancy. See also Supplementary Figure S2.
Figure 4
Figure 4
Properties of BLACK chromatin. (A) Sample plots of binding profiles of the six proteins that are the most prevalent in BLACK chromatin. Genes on both strands as well as chromatin types are depicted below the profiles. Grey blocks in the background correspond to BLACK chromatin domains. (B) Silencing of a white reporter gene in 2,852 P-element insertions in adult eyes (Babenko et al., 2010) separated by chromatin type in Kc cells. The fraction of silenced insertions is higher among those overlapping with BLACK regions than in the rest of the genome (p<2.2*10−16, Chi-squared test). (C) Relative expression levels (log10 scale, normalized to genome-wide average) of BLACK genes in various tissues (Chintapalli et al., 2007). (D) Density of highly conserved non-coding elements (HCNEs) per chromatin type.
Figure 5
Figure 5
RED and YELLOW are two distinct types of euchromatin. (A) Violin plots of replication timing (Schwaiger et al., 2009) per chromatin type. (B) Violin plots of origin of replication complex 2 (ORC2) binding (MacAlpine et al., 2010) per chromatin type. (C) Average binding of MRG15 around 5′ and 3′ ends of genes in RED and YELLOW chromatin. Left panel, alignment to transcript 5′ ends; right panel, alignment to 3′ ends. Only genes that are entirely within one chromatin type are depicted. (D) Average enrichment of H3K36me3 (Bell et al., 2010), plotted as in (C).
Figure 6
Figure 6
Genes in RED and YELLOW differ in regulation and function. (A) Distribution of genes having “broad” and “tissue-specific” expression patterns (defined in (Tomancak et al., 2007)) over the five chromatin types. Left bar shows distribution of all genes for comparison. (B)-(C) GO slim categories that are significantly enriched (B) or depleted (C) in RED compared to YELLOW genes. Bars indicate the fraction of RED and YELLOW genes for the given category (BLACK, GREEN and BLUE are not considered here). Vertical dotted line represents the distribution expected by random chance. The total number of RED and YELLOW genes within each category are indicated on the left. (D) Violin plots of the log2 FAIRE signal per chromatin type (Braunschweig et al., 2009). See also Supplementary Figure S3.
Figure 7
Figure 7
Binding of DBFs to their cognate motifs is differentially guided by chromatin types. (A) Correlations between predicted DNA affinity and actual binding detected by DamID, genome-wide (grey dashed lines) or for each chromatin type (solid lines), for six DBFs as indicated. Curves are loess-fitted lines; raw data is shown in Supplementary Figure S4. (B) Cartoon model depicting the specific guidance of DBFs to their cognate motifs in only certain chromatin types, illustrated for CTCF and MNT. DBF binding to its cognate motif (grey box) is guided by protein-protein interactions. The presence of specific interactors (colored shapes) only in some chromatin types may account for targeting. See also Supplementary Figure S4.

Comment in

  • Chromatin: Colour-coded classification.
    Muers M. Muers M. Nat Rev Genet. 2010 Nov;11(11):745. doi: 10.1038/nrg2887. Epub 2010 Oct 13. Nat Rev Genet. 2010. PMID: 20940735 No abstract available.
  • Chromatin in multicolor.
    Schübeler D. Schübeler D. Cell. 2010 Oct 15;143(2):183-4. doi: 10.1016/j.cell.2010.09.045. Cell. 2010. PMID: 20946976

References

    1. Babenko VN, Makunin IV, Brusentsova IV, Belyaeva ES, Maksimov DA, Belyakin SN, Maroy P, Vasil’eva LA, Zhimulev IF. Paucity and preferential suppression of transgenes in late replication domains of the D. melanogaster genome. BMC Genomics. 2010;11:318. - PMC - PubMed
    1. Beato M, Eisfeld K. Transcription factor access to chromatin. Nucleic Acids Res. 1997;25:3559–3563. - PMC - PubMed
    1. Bell O, Schwaiger M, Oakeley EJ, Lienert F, Beisel C, Stadler MB, Schubeler D. Accessibility of the Drosophila genome discriminates PcG repression, H4K16 acetylation and replication timing. Nat Struct Mol Biol. 2010;17:894–900. - PubMed
    1. Berger SL. The complex language of chromatin regulation during transcription. Nature. 2007;447:407–412. - PubMed
    1. Bianchi-Frias D, Orian A, Delrow JJ, Vazquez J, Rosales-Nieves AE, Parkhurst SM. Hairy transcriptional repression targets and cofactor recruitment in Drosophila. PLoS Biol. 2004;2:E178. - PMC - PubMed

Publication types

MeSH terms

Associated data