. 2010 Dec;80(3):464-76.
doi: 10.1016/j.mvr.2010.09.004. Epub 2010 Oct 1.

A computational model for nitric oxide, nitrite and nitrate biotransport in the microcirculation: effect of reduced nitric oxide consumption by red blood cells and blood velocity

Affiliations

A computational model for nitric oxide, nitrite and nitrate biotransport in the microcirculation: effect of reduced nitric oxide consumption by red blood cells and blood velocity

Prabhakar Deonikar et al. Microvasc Res. 2010 Dec.

Abstract

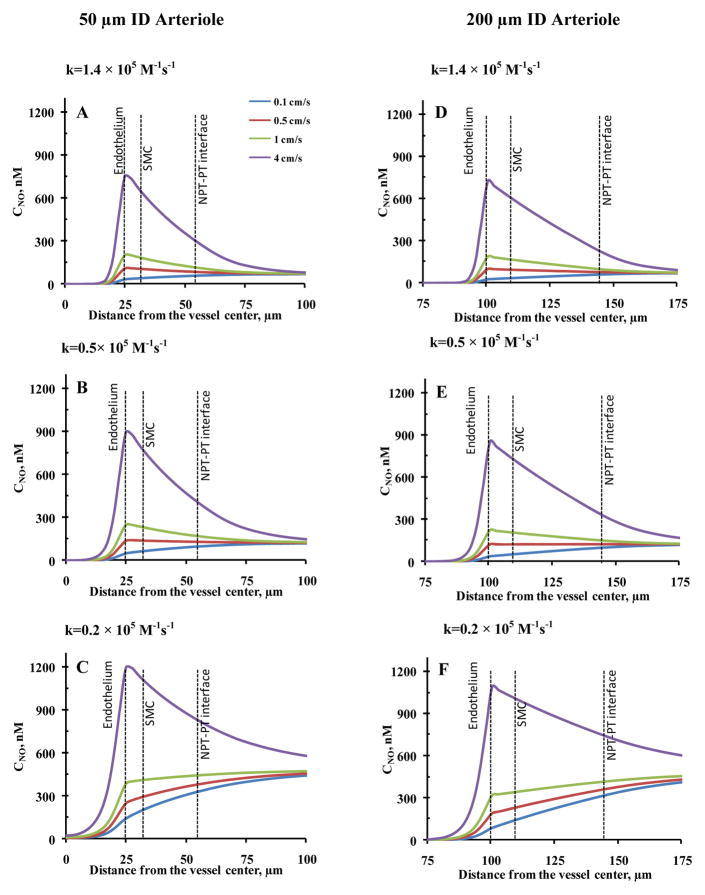
Bioavailability of vasoactive endothelium-derived nitric oxide (NO) in vasculature is a critical factor in regulation of many physiological processes. Consumption of NO by RBC plays a crucial role in maintaining NO bioavailability. Recently, Deonikar and Kavdia (2009b) reported an effective NO-RBC reaction rate constant of 0.2×10(5)M(-1)s(-1) that is ~7 times lower than the commonly used NO-RBC reaction rate constant of 1.4×10(5)M(-1)s(-1). To study the effect of lower NO-RBC reaction rate constant and nitrite and nitrate formation (products of NO metabolism in blood), we developed a 2D mathematical model of NO biotransport in 50 and 200μm ID arterioles to calculate NO concentration in radial and axial directions in the vascular lumen and vascular wall of the arterioles. We also simulated the effect of blood velocity on NO distribution in the arterioles to determine whether NO can be transported to downstream locations in the arteriolar lumen. The results indicate that lowering the NO-RBC reaction rate constant increased the NO concentration in the vascular lumen as well as the vascular wall. Increasing the velocity also led to increase in NO concentration. We predict increased NO concentration gradient along the axial direction with an increase in the velocity. The predicted NO concentration was 281-1163nM in the smooth muscle cell layer for 50μm arteriole over the blood velocity range of 0.5-4cms(-1) for k(NO-RBC) of 0.2×10(5)M(-1)s(-1), which is much higher than the reported values from earlier mathematical modeling studies. The NO concentrations are similar to the experimentally measured vascular wall NO concentration range of 300-1000nM in several different vascular beds. The results are significant from the perspective that the downstream transport of NO is possible under the right circumstances.


Figures

Figure 1
Figure 1
a) Schematic diagram of model geometry. The model geometry consists of concentric cylinders representing subregions of luminal and abluminal regions of the arteriole. The arteriole is divided into luminal and abluminal regions. Luminal region contains subregions representing RBC rich core and cell free zone (CFZ). Abluminal regions include endothelium (EN), interstitial space (IS), smooth muscle cell later (SMC), non perfused tissue (NPT) and parenchymal tissue (PT) perfused with capillaries. NO released from endothelial cells in shear stress dependant manner diffuses to vascular lumen and smooth muscle cells; b) Mesh grid representing the finite elements. The software generates finite elements in proportion with the concentration gradients in the different regions. More finite elements are generated where the concentration gradient is higher. Relative accuracy was set to be 0.005 for all the simulations.
Figure 1
Figure 1
a) Schematic diagram of model geometry. The model geometry consists of concentric cylinders representing subregions of luminal and abluminal regions of the arteriole. The arteriole is divided into luminal and abluminal regions. Luminal region contains subregions representing RBC rich core and cell free zone (CFZ). Abluminal regions include endothelium (EN), interstitial space (IS), smooth muscle cell later (SMC), non perfused tissue (NPT) and parenchymal tissue (PT) perfused with capillaries. NO released from endothelial cells in shear stress dependant manner diffuses to vascular lumen and smooth muscle cells; b) Mesh grid representing the finite elements. The software generates finite elements in proportion with the concentration gradients in the different regions. More finite elements are generated where the concentration gradient is higher. Relative accuracy was set to be 0.005 for all the simulations.
Figure 2
Figure 2
NO concentration profiles across all the regions of arterioles at the end of the arteriolar segments. NO concentrations at the end of the arteriolar segments is plotted as a function of distance from the vessel center for 50 μm ID arteriole (panels A–C) and 200 μm ID arteriole (panels D–F). For both the arterioles, NO concentration in all the subregions increased with blood velocity for all the NO-RBC reaction rate constants.
Figure 3
Figure 3
A) NO concentration distribution in vascular lumen of arteriole segment of 50 μm ID and 500 μm length. Panels A–D represent the NO concentration for NO-RBC reaction rate constant of 1.4×10⁵ M−1 s−1 for blood velocity range of 0.1–4 cm/s, respectively. Panels E–H represent the NO concentration for NO-RBC reaction rate constant of 0.5×10⁵ M−1 s−1 for blood velocity range of 0.1–4 cm/s, respectively. Panels I–L represent the NO concentration distribution for NO-RBC reaction rate constant of 0.2×10⁵ M−1 s−1 for blood velocity range of 0.1–4 cm/s, respectively. NO availability in the vascular lumen increased with decrease in NO-RBC reaction rate constant and increase in blood velocity. B) NO concentration in part of vascular lumen (25 μm from the vessel wall) of arteriolar segment of 200 μm ID and 2000 μm length. Panels A–D represent the NO concentration for NO-RBC reaction rate constant of 1.4×10⁵ M−1 s−1 for blood velocity range of 0.1–4 cm/s, respectively. Panels E–H represent the NO concentration for NO-RBC reaction rate constant of 0.5×10⁵ M−1 s−1 for blood velocity range of 0.1–4 cm/s, respectively. Panels I–L represent the NO concentration for NO-RBC reaction rate constant of 0.2×10⁵ M−1 s−1 for blood velocity range of 0.1–4 cm/s, respectively. NO availability in the vascular lumen increased with decrease in NO-RBC reaction rate constant and increase in blood velocity.
Figure 4
Figure 4
A) Nitrite concentration profiles in vascular lumen of arteriole segment of 50 μm ID and 500 μm length. Panels A–D, E–H and I–L represent the nitrite concentration profiles for NO-RBC reaction rate constant of 1.4×10⁵ M−1 s−1, 0.5×10⁵ M−1 s−1 and 0.2×10⁵ M−1 s−1, respectively for blood velocity range of 0.1–4 cm/s. Nitrite concentrations in the vascular lumen increased with decrease in NO-RBC reaction rate constant and increase in blood velocity. B) Nitrite concentration in part of the vascular lumen (25 μm from the vessel wall) of arteriolar segment of 200 μm ID and 2000 μm length. Panels A–D, E–H and I–L represent the nitrite concentration profiles for NO-RBC reaction rate constant of 1.4×10⁵ M−1 s−1, 0.5×10⁵ M−1 s−1 and 0.2×10⁵ M−1 s−1, respectively for blood velocity range of 0.1–4 cm/s. Nitrite concentrations in the vascular lumen increased with decrease in NO-RBC reaction rate constant and increase in blood velocity.
Figure 5
Figure 5
A) Nitrate concentration profiles in RBC core region of vascular lumen of arteriole segment of 50 μm ID and 500 μm length. Panels A–D, E–H and I–L represent the nitrate concentration profiles for NO-RBC reaction rate constant of 1.4×10⁵ M−1 s−1, 0.5×10⁵ M−1 s−1 and 0.2×10⁵ M−1 s−1, respectively for blood velocity range of 0.1–4 cm/s. Nitrate concentrations in the vascular lumen increased with decrease in NO-RBC reaction rate constant and increase in blood velocity. B) Nitrate concentration in part of the RBC core region vascular lumen (from RBC core-CFZ interface to 25 μm distance from the vessel wall) of 200 μm diameter and 2000 μm length arteriolar segment. Panels A–D, E–H and I–L represent the nitrate concentration profiles for NO-RBC reaction rate constant of 1.4×10⁵ M−1 s−1, 0.5×10⁵ M−1 s−1 and 0.2×10⁵ M−1 s−1, respectively for blood velocity range of 0.1–4 cm/s. Nitrate concentrations in the vascular lumen decreased with decrease in NO-RBC reaction rate constant and increase in blood velocity.
Figure 6
Figure 6
NO concentration levels at endothelium and smooth muscle cell layer at the end of arteriolar segments. NO concentration levels for 50 μm ID arteriole at the endothelium (A) and smooth muscle cell layer (B) are plotted as a function of blood velocity. Panels C and D represent the endothelium and smooth muscle cell layer NO concentration levels, respectively, for 200 μm ID arteriole. CNOen represents the NO concentrations at the cell free zone-endothelium interface and CNOen represents NO concentrations at the smooth muscle cell-non perfused tissue interface.
Figure 7
Figure 7
Mixing cup concentrations of NO, nitrite and nitrate exiting the arteriolar segments. NO, nitrite, and nitrate are plotted as a function of blood velocity and kNO-RBC. Panels A, B and C represent NO, nitrite and nitrate concentrations in the exiting perfusate of 50 μm ID arteriolar segment, respectively. Total NO, nitrite and nitrate mixing cup concentrations for 200 μm ID arteriolar are plotted in panels D, E and F respectively. Mixing cup NO concentrations increased linearly with blood velocity and increased with decrease in NO-RBC reaction rate constants for both arterioles. Total nitrite formations increased with increase in blood velocity and decrease in NO-RBC reaction rate constant for both the arterioles. Total nitrate formations decreased with blood velocity, and increased with increase in NO-RBC reaction rate constant.

References

    1. Arnold WP, et al. Nitric oxide activates guanylate cyclase and increases guanosine 3′:5′-cyclic monophosphate levels in various tissue preparations. Proc Natl Acad Sci U S A. 1977;74:3203–7. - PMC - PubMed
    1. Azarov I, et al. Nitric oxide scavenging by red blood cells as a function of hematocrit and oxygenation. J Biol Chem. 2005;280:39024–32. - PubMed
    1. Basu S, et al. Catalytic generation of N2O3 by the concerted nitrite reductase and anhydrase activity of hemoglobin. Nat Chem Biol. 2007;3:785–94. - PubMed
    1. Bauser-Heaton HD, Bohlen HG. Cerebral microvascular dilation during hypotension and decreased oxygen tension: a role for nNOS. Am J Physiol Heart Circ Physiol. 2007;293:H2193–201. - PubMed
    1. Bevan JA, et al. As human pial arteries (internal diameter 200–1000 microm) get smaller, their wall thickness and capacity to develop tension relative to their diameter increase. Life Sci. 1999;65:1153–61. - PubMed

Publication types

LinkOut - more resources