. 2010:482:131-65.
doi: 10.1016/S0076-6879(10)82005-1.

Fourier-Bessel reconstruction of helical assemblies

Affiliations

Fourier-Bessel reconstruction of helical assemblies

Ruben Diaz et al. Methods Enzymol. 2010.

Abstract

Helical symmetry is commonly used for building macromolecular assemblies. Helical symmetry is naturally present in viruses and cytoskeletal filaments and also occurs during crystallization of isolated proteins, such as Ca-ATPase and the nicotinic acetyl choline receptor. Structure determination of helical assemblies by electron microscopy has a long history dating back to the original work on three-dimensional (3D) reconstruction. A helix offers distinct advantages for structure determination. Not only can one improve resolution by averaging across the constituent subunits, but each helical assembly provides multiple views of these subunits and thus provides a complete 3D data set. This review focuses on Fourier methods of helical reconstruction, covering the theoretical background, a step-by-step guide to the process, and a practical example based on previous work with Ca-ATPase. Given recent results from helical reconstructions at atomic resolution and the development of graphical user interfaces to aid in the process, these methods are likely to continue to make an important contribution to the field of structural biology.


Figures

Fig. 1
Fig. 1
Diagrams depicting the geometry of a helix. (A) A continuous helix is characterized by the pitch (P) and the radius (r) adopted by the spiral. Either a Cartesian coordinate system (x,y,z) or cylindrical coordinate system (r,φ,z) can be used. In either case, the z axis corresponds to the helical axis. (B) Helical assemblies are generally composed of identical subunits arranged along the path of a continuous helix. This requires additional parameters, Δφ and Δz, which describe the incremental translation and rotation between the subunits. This helix contains an exact repeat of 8 subunits in one turn, thus, Δφ=45°.
Figure 2
Figure 2
Relationship between a planar 2D lattice and a helical assembly. (A) The 2D lattice is characterized by a regular array of points. An infinite variety of lines can be drawn through these points and each set of lines can be assigned a Miller index (h,k). For example, the black lines shown here could be assigned to the (1,0) and (0,1) directions. Two circumferential vectors are shown in green and red and these can be used to generate two unique helical structures shown in panel B. The dashed red and green lines are parallel to the z axes in the resulting helical structures. (B) Helical lattices result from superimposing lattice points on either end of the circumferential vectors shown in panel A. Each set of lines through the 2D lattice are transformed into a family of helices. The start number (n) of each helix corresponds to the number of lines that cross the circumferential vector. The red circumferential vector produces helices with n=1 and n=10. The green circumferential vector produces helices with n=−4 and n=8. For a left-handed helix, n<0.
Fig. 3
Fig. 3
Fourier transform of a helical assembly. (A) The 2D Fourier transform from a Ca-ATPase helical tube (e.g., Fig. 5a) is characterized by discrete layer lines that run horizontally across the transform. Each layer line corresponds to a helical family (c.f., Fig. 2) and can be assigned a Miller index (h,k). The layer line running through the origin is called the equator and has a Miller index of (0,0). The vertical axis is called the meridian and the transform has mirror symmetry across the meridian. The start number of each helix (n) is shown next to each Miller index (h,k; n), and this start number determines the order of the Bessel function appearing on that layer line. The red circles indicate the zeros of the contrast transfer function and the highest layer line (3,11) corresponds to 10 Å resolution. (B) 3D distribution of three layer lines from a hypothetical helical assembly with Bessel orders of 0, 1, and 2, as indicated. The Z axis corresponds to the meridian, the X axis corresponds to the equator, and the Y axis is the imaging direction. Thus, the X-Z plane would be obtained by Fourier transformation of a projection image (e.g., panel A). The amplitude of the 3D Fourier transform is cylindrically symmetric about the meridian, but the phase (depicted by the color table at the bottom) oscillates azimuthally, depending on the Bessel order. Thus, the phase along the n=0 layer line (equator) remains constant; the phase along the n=1 layer line sweeps through one period and the phase along the n=2 layer line sweeps through two periods. (C) Amplitudes of Bessel functions with orders n=0-4. Note that as n increases, the position of the first maximum moves away from the origin.
Fig. 4
Fig. 4
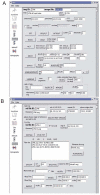
Graphical user interface for helical reconstruction. This program (EMIP) collects information from the user and guides him/her through the various steps required for 3D reconstruction. Popup text provides information about each of the steps and a right-click on each button displays relevant log files. (A) Steps in processing individual tubes include masking, Fourier transformation, finding the repeat distance, searching for out-of-plane tilt, unbending and addition of CTF parameters. (B) Steps in averaging Fourier data together and calculation of the 3D map. This user interface was written in Python using the wxPython library for creation of graphical widgets and is available upon request.
Fig. 5
Fig. 5
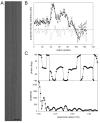
Masking and centering of an individual helical assembly. (A) An image of a helical tube of Ca-ATPase. Only the straightest part of the assembly would be used for reconstruction, i.e., the upper half. Scale bar corresponds to 60 nm. (B) Plot of density after projecting the image along the helical axis. The origin of the plot corresponds to the center of the tube and density from right (○) and left (●) sides have been plotted together with their average (solid line). The difference between the two sides is plotted as a broken line. The outer radius of this tube is ~115 pixels, which falls just outside the negative density ripple caused by the CTF. (C) Amplitude and phase data from the equator. The fact that phases are close to either 0° or 180° indicates that the tube is well centered.
Fig. 6
Fig. 6
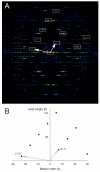
Indexing of layer lines in the Fourier transform of a helical assembly. (A) Overlay of the near-side lattice on the Fourier transform of Ca-ATPase. (B) Corresponding plot of Bessel order (n) vs. layer line height (ℓ). Assignment of (1,0) and (0,1) layer lines is arbitrary, but once chosen then all of the other visible layer lines should be either a linear combination of these two, or a consequence of mm symmetry in the transform. The radial positions of the layer lines are distorted relative to a planar 2D lattice due to the behavior of Bessel functions, which have a non-linear relationship between the radial position of their first maximum and their order, n. Nevertheless, the axial positions of the layer lines should be accurate.
Fig. 7
Fig. 7
Out-of-plane tilt. These diagrams illustrate the relationship between the 3D Fourier transform and the central section that results from the projection along the viewing direction (Y). Due to this projection layer lines are sampled where they intersect the X-Z plane (black). (A) Untilted helical assembly where the helical axis is coincident with the Z axis of the transform and layer lines are sampled at azimuthal angles (ψ) equal to 0° and 180°. (B) Helical assembly that is tilted away from the viewing direction, causing sampling of layer lines at ψ≠0° and 180°. Z′ corresponds to the helical axis and the angle between Z′ and Z corresponds to the out-of-plane tilt, Ω. This tilt produces systematic phase shifts that are dependent on the order of the Bessel function along each layer line.
Fig. 8
Fig. 8
Mean radial density distribution derived from the equator of an averaged data set. The solid line corresponds to data that has been appropriately corrected for the CTF, thus producing positive density at radii between 225 and 400 Å. For the dashed line, the CTF correction was limited along the equator. Although the structure at any given radius is unchanged, the overall distribution of mass is dramatically affected, making it impossible to render the molecular surface based on a single density threshold (c.f., Fig. 9c).
Fig. 9
Fig. 9
Fourier-Bessel reconstruction of Ca-ATPase. (A) Section from the reconstruction with contours superimposed on the densities. Evaluation of contour maps can be useful in delineating the individual molecules composing the structure. (B) Masking of a single molecule from the map, which is useful both for real-space averaging and for display. (C) Surface representation of a single molecule of Ca-ATPase defined by density threshold. The black, horizontal lines correspond to the boundaries of the membrane. In this case, this density threshold corresponds to a volume recovery of ~75% of the expected molecular mass. IMOD (Kremer et al., 1996) was used for panels A and B, and Chimera (Pettersen et al., 2004) was used for panel C.
Fig. 10
Fig. 10
Evaluation of the resolution of a helical reconstruction. Both the Fourier Shell Coefficient (FSC) and the Fourier Shell phase residual result from comparing masked and aligned molecules obtained from independent halves of the data set. The two-fold phase residual is calculated from averaged Gn,ℓ(R) derived from the entire data set. A two-fold phase residual of 45° is random, whereas a Fourier Shell phase residual of 90° is random. Data reproduced from Xu et al. (2002).
Fig. 11
Fig. 11
Averaging of gn,ℓ(r) from helical assemblies of Ca-ATPase. (A) After alignment, amplitudes from three different symmetry groups are shown (thin, dashed lines), together with the average (thick solid line). (B) Two-fold phase residuals are compared for the Fourier space average from a single symmetry group (−22,6, ■), for the real-space average of the three symmetry groups (●), and for the averaged of gn,ℓ(r) from these same three symmetry groups (△). The improvements obtained by averaging gn,ℓ(r) are comparable to those obtained by real-space averaging. Data reproduced from DeRosier et al. (1999).

Similar articles

Cited by

  • Calcium sensitive ring-like oligomers formed by synaptotagmin.
    Wang J, Bello O, Auclair SM, Wang J, Coleman J, Pincet F, Krishnakumar SS, Sindelar CV, Rothman JE. Wang J, et al. Proc Natl Acad Sci U S A. 2014 Sep 23;111(38):13966-71. doi: 10.1073/pnas.1415849111. Epub 2014 Sep 8. Proc Natl Acad Sci U S A. 2014. PMID: 25201968 Free PMC article.
  • Outcome of the first electron microscopy validation task force meeting.
    Henderson R, Sali A, Baker ML, Carragher B, Devkota B, Downing KH, Egelman EH, Feng Z, Frank J, Grigorieff N, Jiang W, Ludtke SJ, Medalia O, Penczek PA, Rosenthal PB, Rossmann MG, Schmid MF, Schröder GF, Steven AC, Stokes DL, Westbrook JD, Wriggers W, Yang H, Young J, Berman HM, Chiu W, Kleywegt GJ, Lawson CL. Henderson R, et al. Structure. 2012 Feb 8;20(2):205-14. doi: 10.1016/j.str.2011.12.014. Structure. 2012. PMID: 22325770 Free PMC article.
  • Real-space processing of helical filaments in SPARX.
    Behrmann E, Tao G, Stokes DL, Egelman EH, Raunser S, Penczek PA. Behrmann E, et al. J Struct Biol. 2012 Feb;177(2):302-13. doi: 10.1016/j.jsb.2011.12.020. Epub 2012 Jan 11. J Struct Biol. 2012. PMID: 22248449 Free PMC article.
  • Deducing the symmetry of helical assemblies: Applications to membrane proteins.
    Coudray N, Lasala R, Zhang Z, Clark KM, Dumont ME, Stokes DL. Coudray N, et al. J Struct Biol. 2016 Aug;195(2):167-178. doi: 10.1016/j.jsb.2016.05.011. Epub 2016 May 30. J Struct Biol. 2016. PMID: 27255388 Free PMC article.
  • Inward-facing conformation of the zinc transporter YiiP revealed by cryoelectron microscopy.
    Coudray N, Valvo S, Hu M, Lasala R, Kim C, Vink M, Zhou M, Provasi D, Filizola M, Tao J, Fang J, Penczek PA, Ubarretxena-Belandia I, Stokes DL. Coudray N, et al. Proc Natl Acad Sci U S A. 2013 Feb 5;110(6):2140-5. doi: 10.1073/pnas.1215455110. Epub 2013 Jan 22. Proc Natl Acad Sci U S A. 2013. PMID: 23341604 Free PMC article.

References

    1. Beroukhim R, Unwin N. Distortion correction of tubular crystals: Improvements in the acetylcholine receptor structure. Ultramicroscopy. 1997;70:57–81. - PubMed
    1. Bullitt ES, DeRosier DJ, Coluccio LM, Tilney LG. Three-dimensional reconstruction of an actin bundle. J. Cell Biol. 1988;107:597–611. - PMC - PubMed
    1. Castellani L, Hardwicke PM, Vibert P. Dimer ribbons in the three-dimensional structure of sarcoplasmic reticulum. J. Mol. Biol. 1985;185:579–594. - PubMed
    1. Chen YJ, Zhang P, Egelman EH, Hinshaw JE. The stalk region of dynamin drives the constriction of dynamin tubes. Nat Struct Mol Biol. 2004;11:574–5. - PubMed
    1. Cochran W, Crick FHC, Vand V. The Structure of Synthetic Polypeptides. I. The Transform of Atoms on a Helix. Acta Cryst. 1952;5:581–586.

MeSH terms

LinkOut - more resources